Monitoring Synology DSM Infrastructure
Synology DSM is a custom build of Linux using Upstart. Follow the tarball assisted install for the New Relic Infrastructure Agent on Synology to start monitoring Synology devices without Docker.
In this example, I use a Synology DS214play device (32-bit Intel Processor) with DSM 6.2 installed.
Summary for Intel Atom Devices
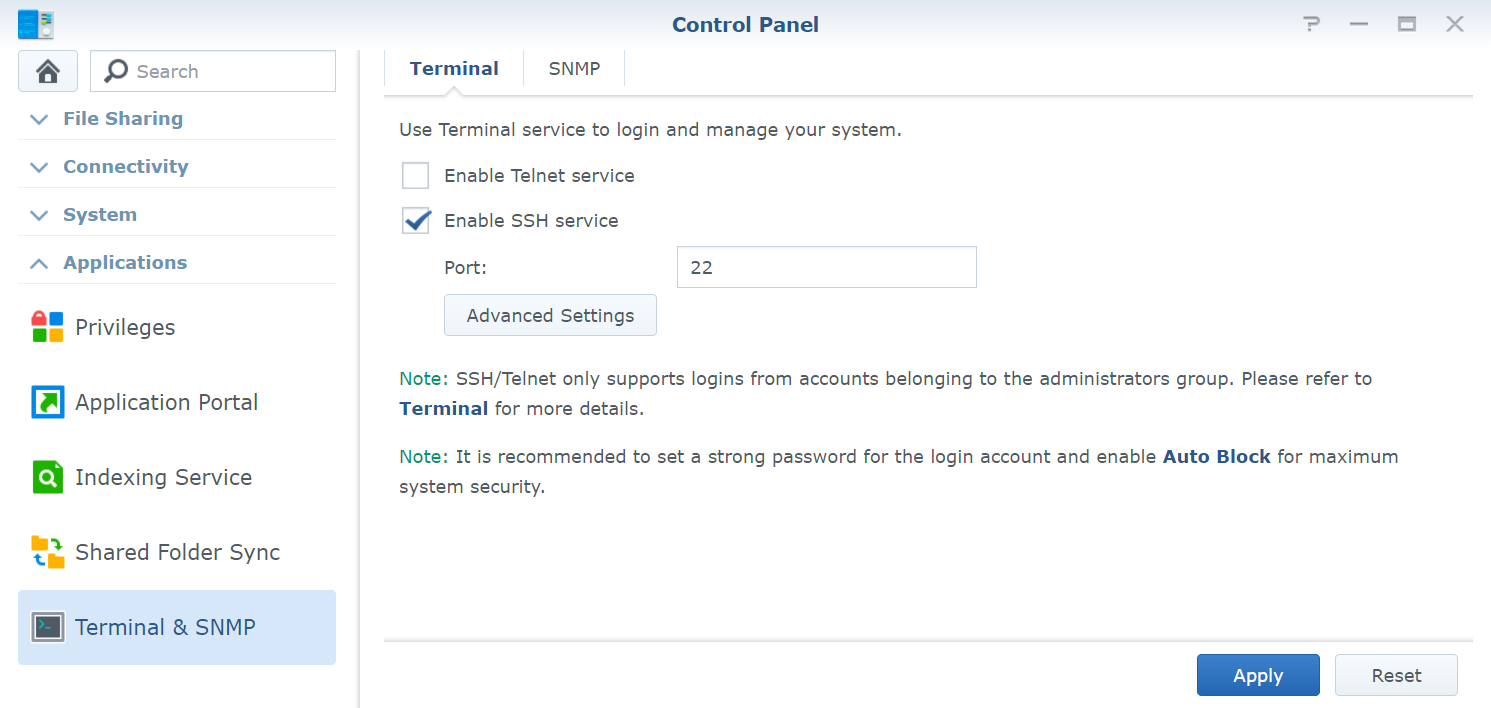
Start by enabling SSH on your Synology device:
- Control Panel
- Terminal & SNMP
- Terminal > Enable SSH Service > Apply
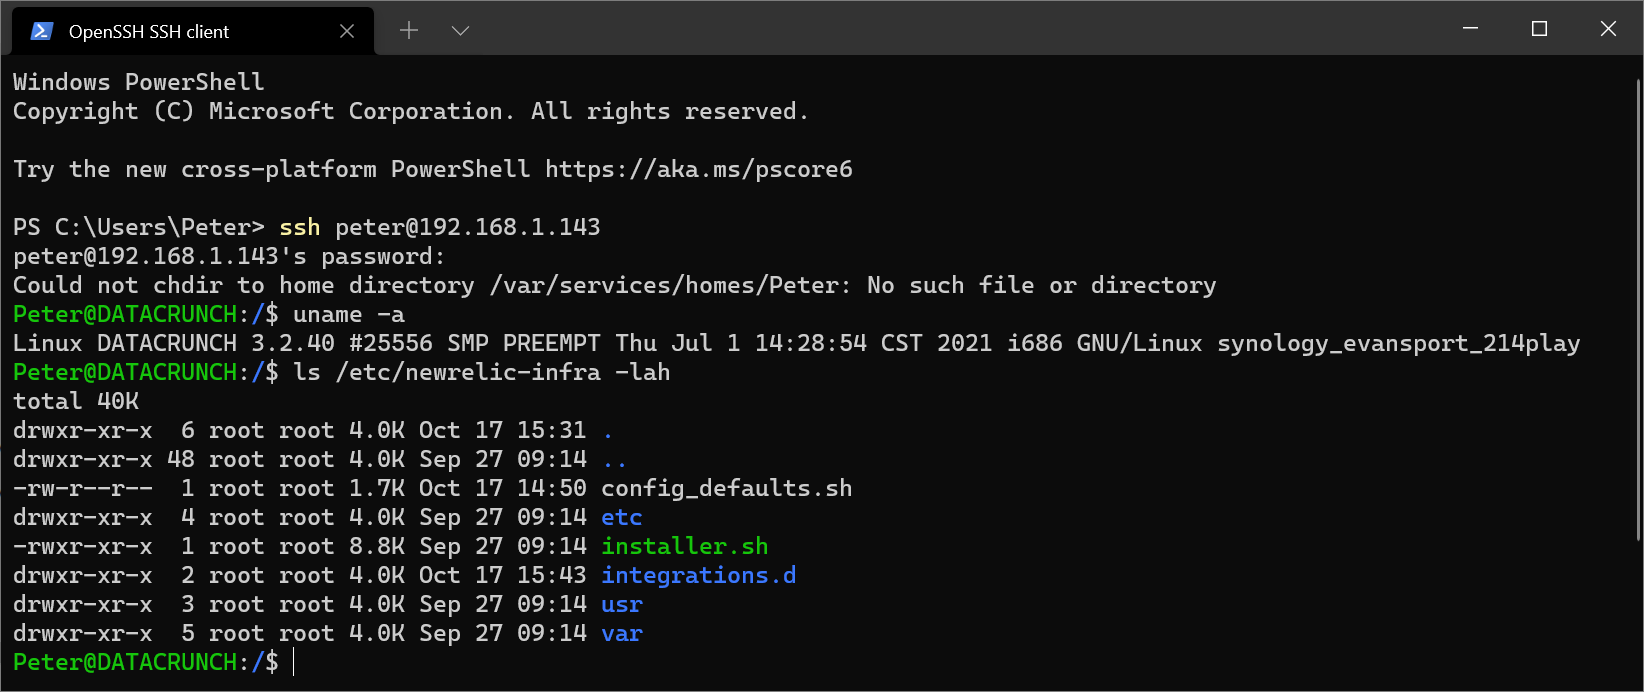
Next, open your terminal and enter ssh user@synology. You may get an error message saying your home directory does not exist and will start at the root directory /.
-
Download New Relic Infrastructure Agent. In this case, my Synology DS214play uses an Intel Atom CE5335 processor which is 32-bit only (ARM and ARM64 variants of the New Relic Infrastructure agent are also available here):
sudo curl https://download.newrelic.com/infrastructure_agent/binaries/linux/386/newrelic-infra_linux_1.20.4_386.tar.gz --output newrelic-infra_linux_1.20.4_386.tar.gz -
Extract:
sudo tar -xf newrelic-infra_linux_1.20.4_386.tar.gz -
Append your New Relic license key (or edit in
vi):
echo "license_key=\"a1b2c3d4e5f6g6h7i7j8k9l0m9n8o7p6q5r4NRAL\"" | sudo tee -a /etc/newrelic-infra/config_defaults.sh -
Run installer script:
sudo /etc/newrelic-infra/installer.sh -
Check if service is running:
sudo initctl status newrelic-infra -
If service is not running, try restarting:
sudo initctl restart newrelic-infra
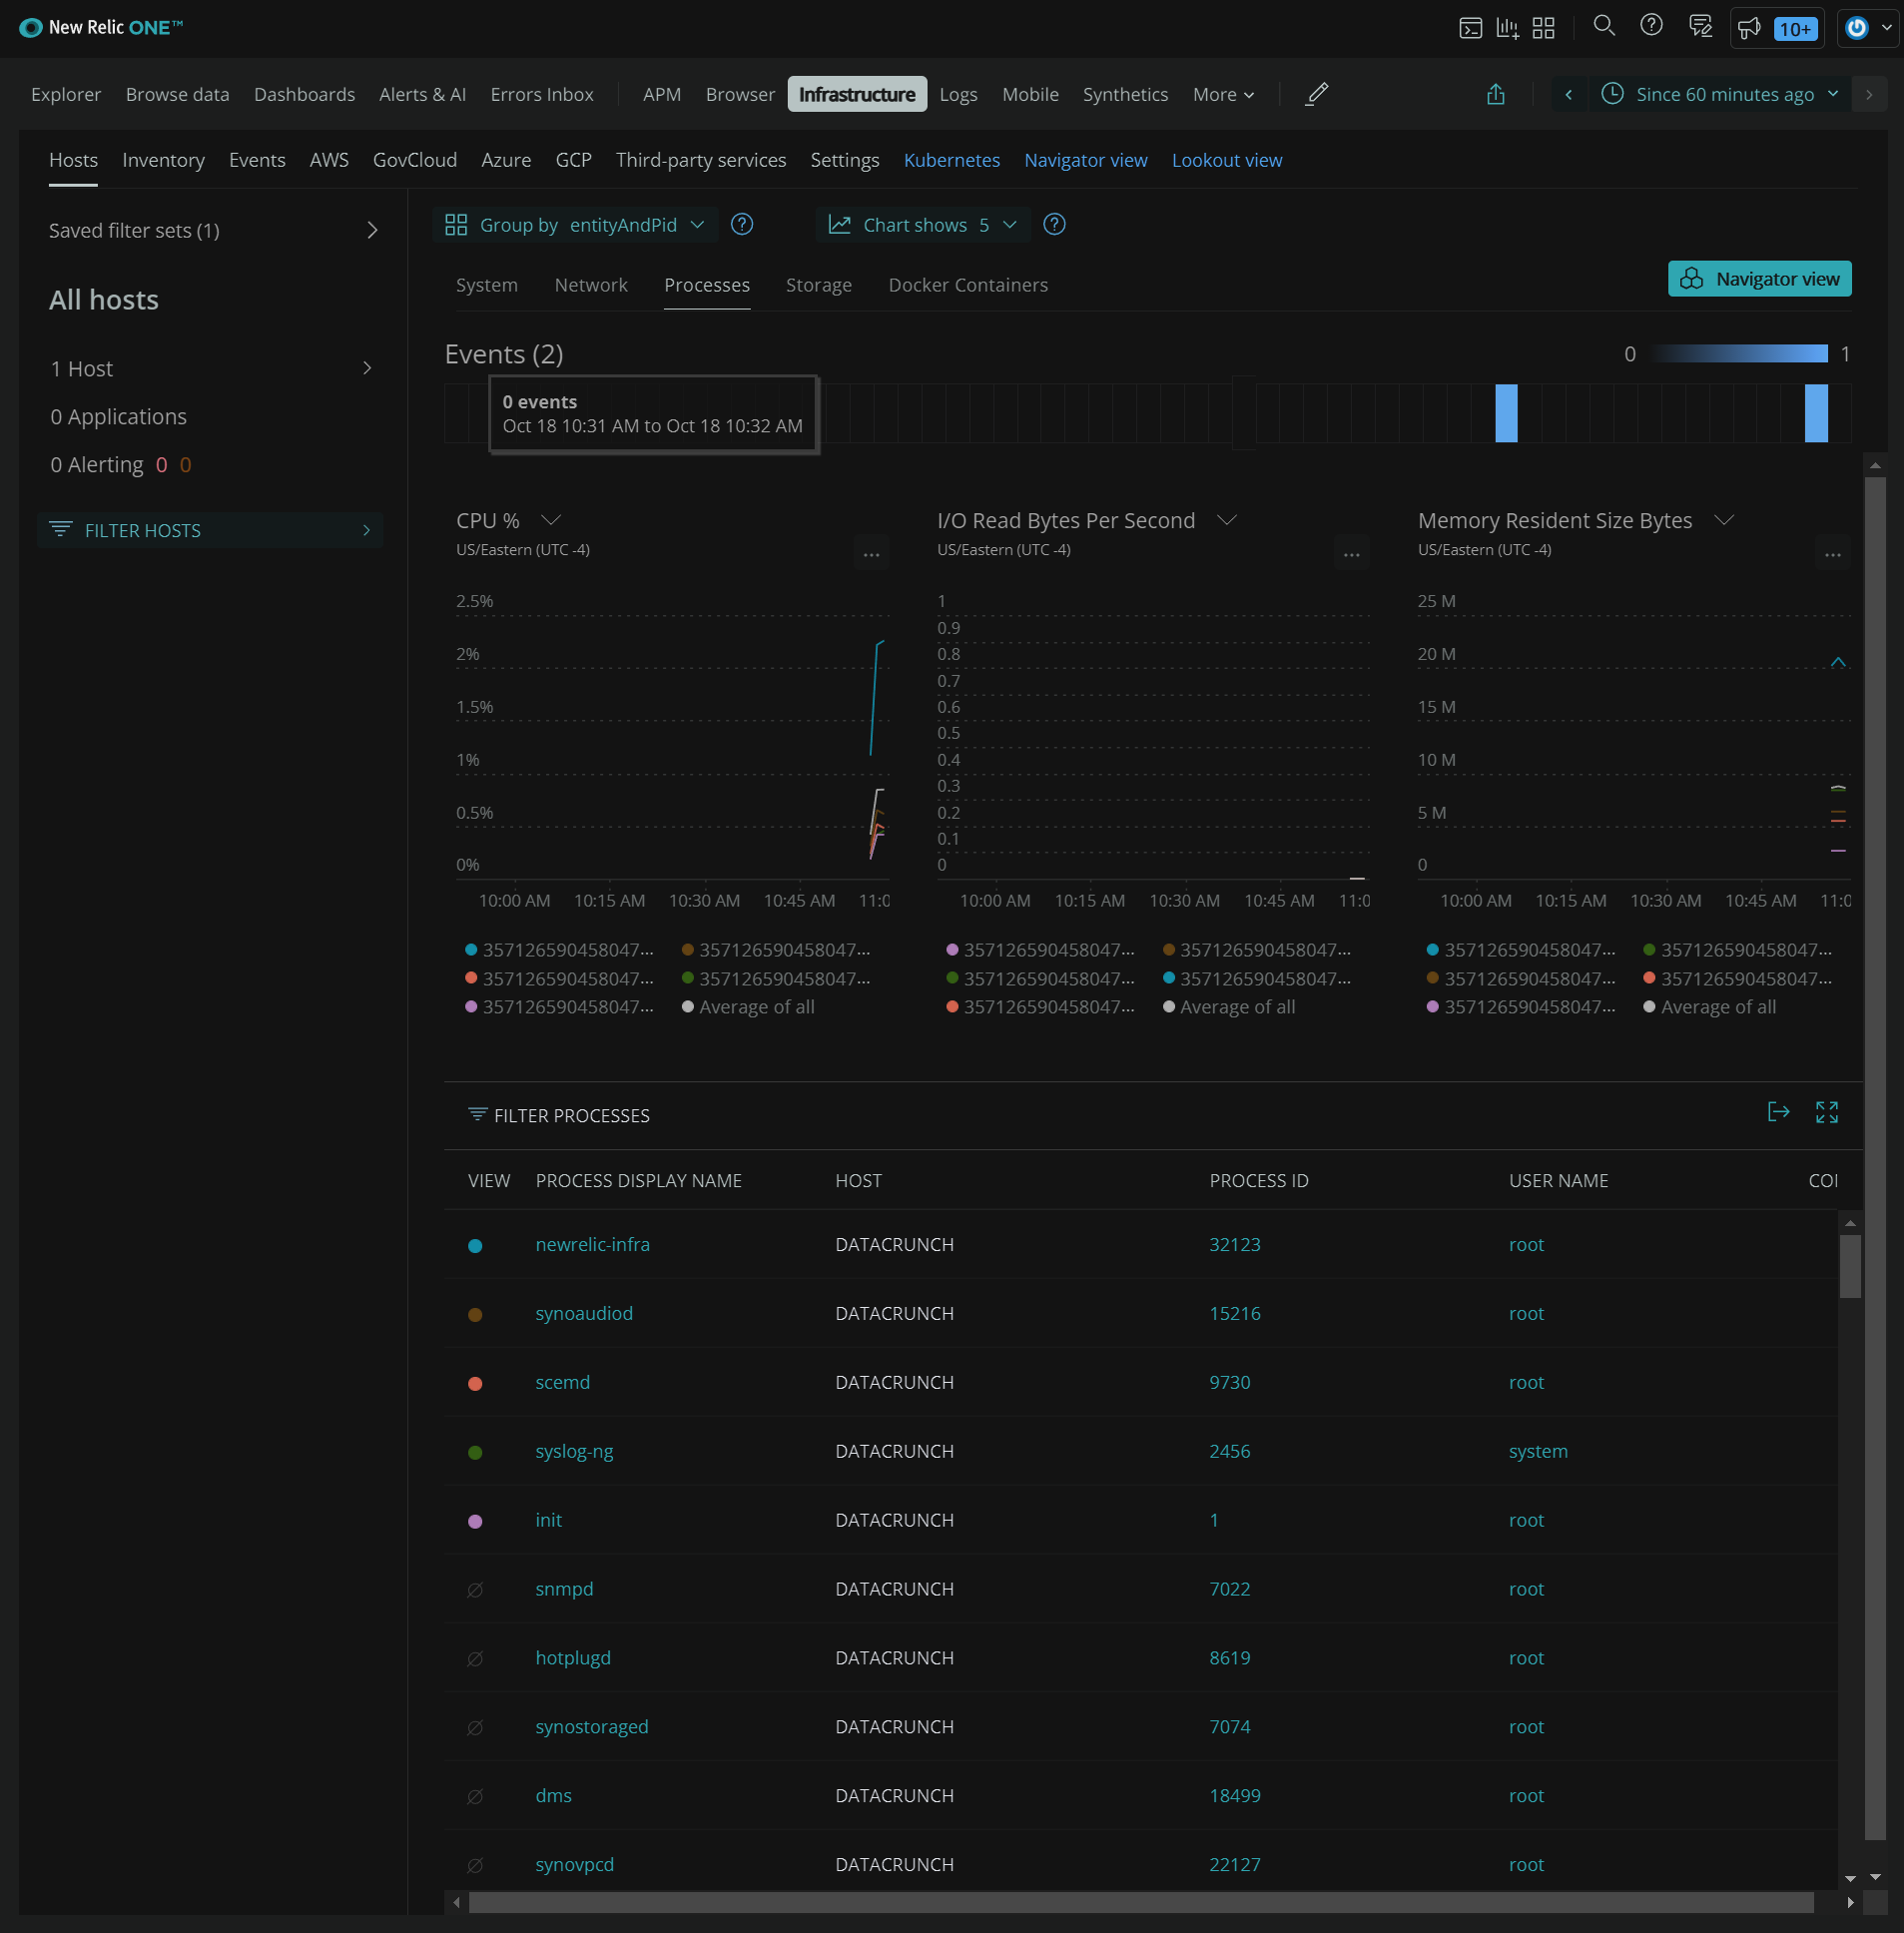
Infrastructure Data Captured
- System
- CPU %
- Load Average
- Memory Free %
- Network
- Transmit Bytes per Second
- Receive Bytes per Second
- Errors per Second
- Processes: Not reported by default.
- To enable,
echo "enable_process_metrics: true" | sudo tee -a /etc/newrelic-infra.ymland restart service
- To enable,
- Storage:
- Disk Used %
- Total Utilization %
- Read/Write Bytes per Second
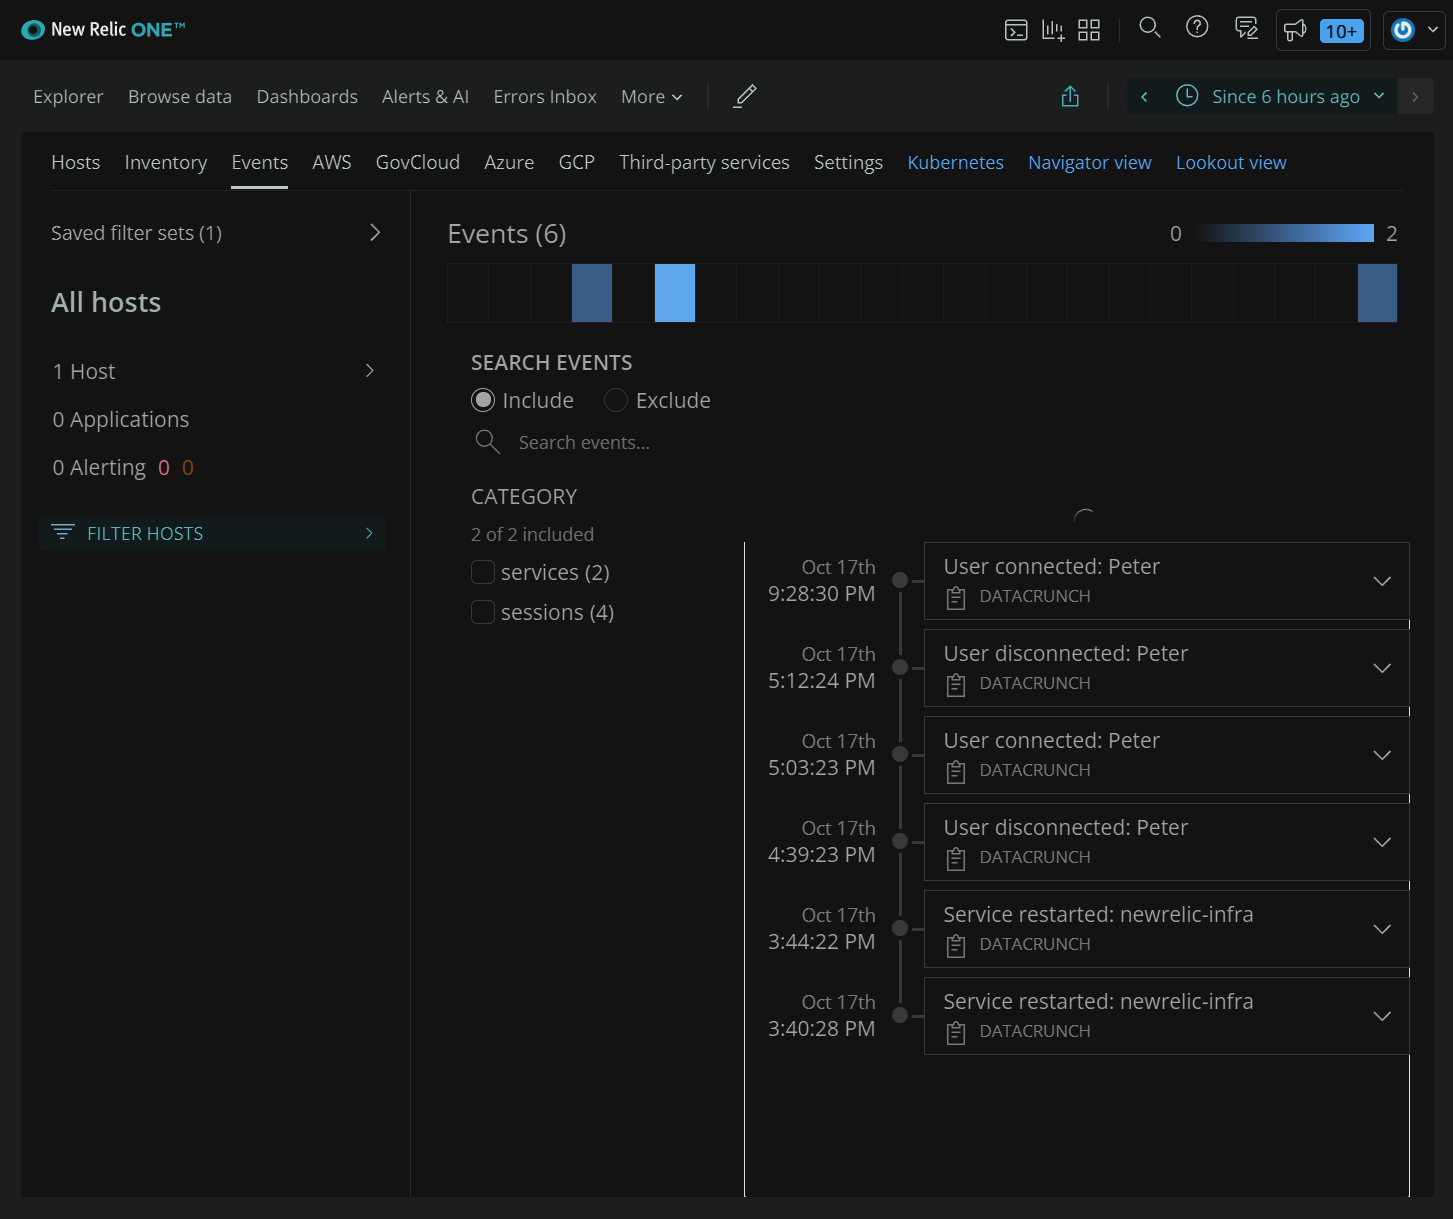
- Events
Dashboards
Here are some useful dashboards and their NRQL query.
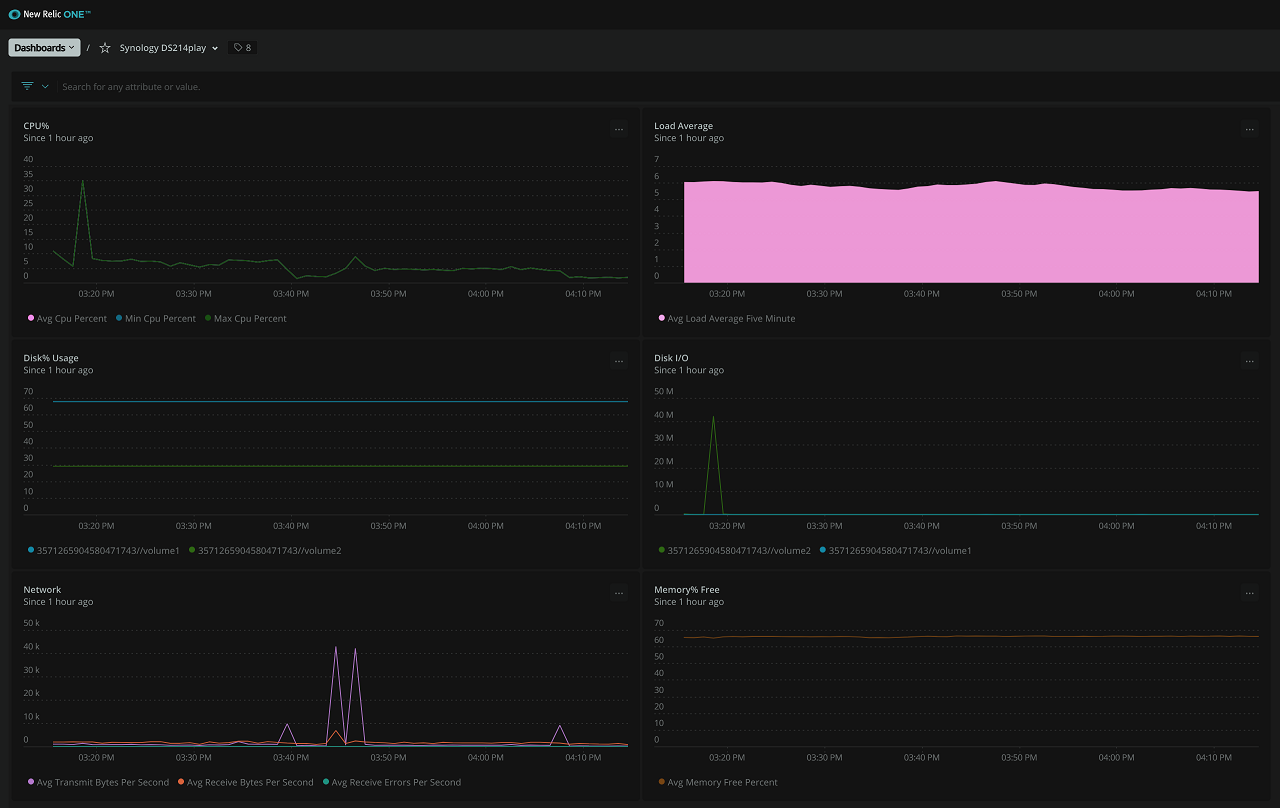
CPU %
SELECT average(cpuPercent), min(cpuPercent), max(cpuPercent) FROM SystemSample WHERE entityName = 'DATACRUNCH' timeseries
Average Load
SELECT average(loadAverageFifteenMinute), average(loadAverageFiveMinute), average(loadAverageOneMinute) FROM SystemSample WHERE entityName = 'DATACRUNCH' TIMESERIES
Memory % Free
SELECT average(memoryUsedBytes), average(memoryCachedBytes), average(memorySharedBytes), average(memorySlabBytes) FROM SystemSample WHERE entityName = 'DATACRUNCH' TIMESERIES
Disk % Usage
SELECT average(diskUsedPercent) FROM StorageSample WHERE entityName = 'DATACRUNCH' FACET entityAndMountPoint TIMESERIES
Disk I/O
SELECT average(readWriteBytesPerSecond OR readBytesPerSecond+writeBytesPerSecond) FROM StorageSample WHERE hostname = 'DATACRUNCH' FACET entityAndMountPoint TIMESERIES
Network I/O
SELECT average(transmitBytesPerSecond), average(receiveBytesPerSecond), average(receiveErrorsPerSecond) FROM NetworkSample WHERE entityName = 'DATACRUNCH' TIMESERIES
Events
SELECT changedPath, summary, changeType, source FROM InfrastructureEvent WHERE entityName = 'DATACRUNCH' SINCE 72 HOURS AGO
Processes
SELECT max(cpuPercent) FROM ProcessSample WHERE entityName = 'DATACRUNCH' AND processDisplayName != 'newrelic-infra' FACET processDisplayName TIMESERIES
Cost Summary
After enabling the infrastructure agent for 2 days, only 100 MB of data was ingested per day. This works out to about 3GB per month ingested, far below the 100GB included in the free-tier account.