Monitoring Raspberry Pi OS Infrastructure
Raspberry Pi OS custom build of Debian (Linux). Follow the tarball assisted install for the New Relic Infrastructure Agent on Synology to start monitoring Raspberry Pi devices without Docker.
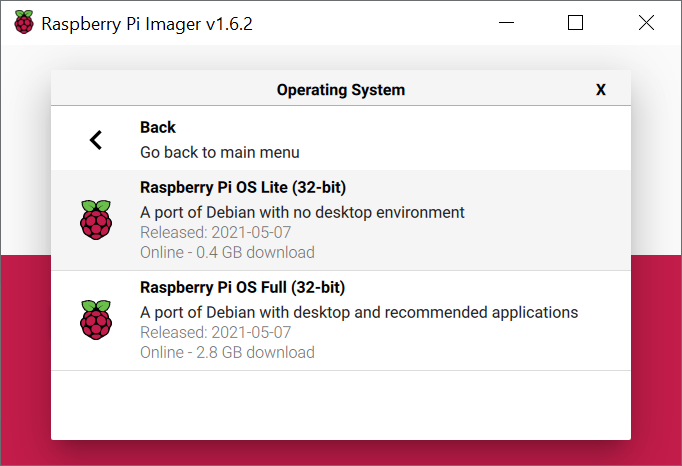
In this example, I use a Raspberry Pi 4B (8GB) device with Rasbberry Pi OS Lite (32-bit) installed.
Summary for Raspberry Pi Devices
Start by enabling SSH on your Raspberry Pi device:
sudo raspi-config- Select
Interface Optionsand pressENTER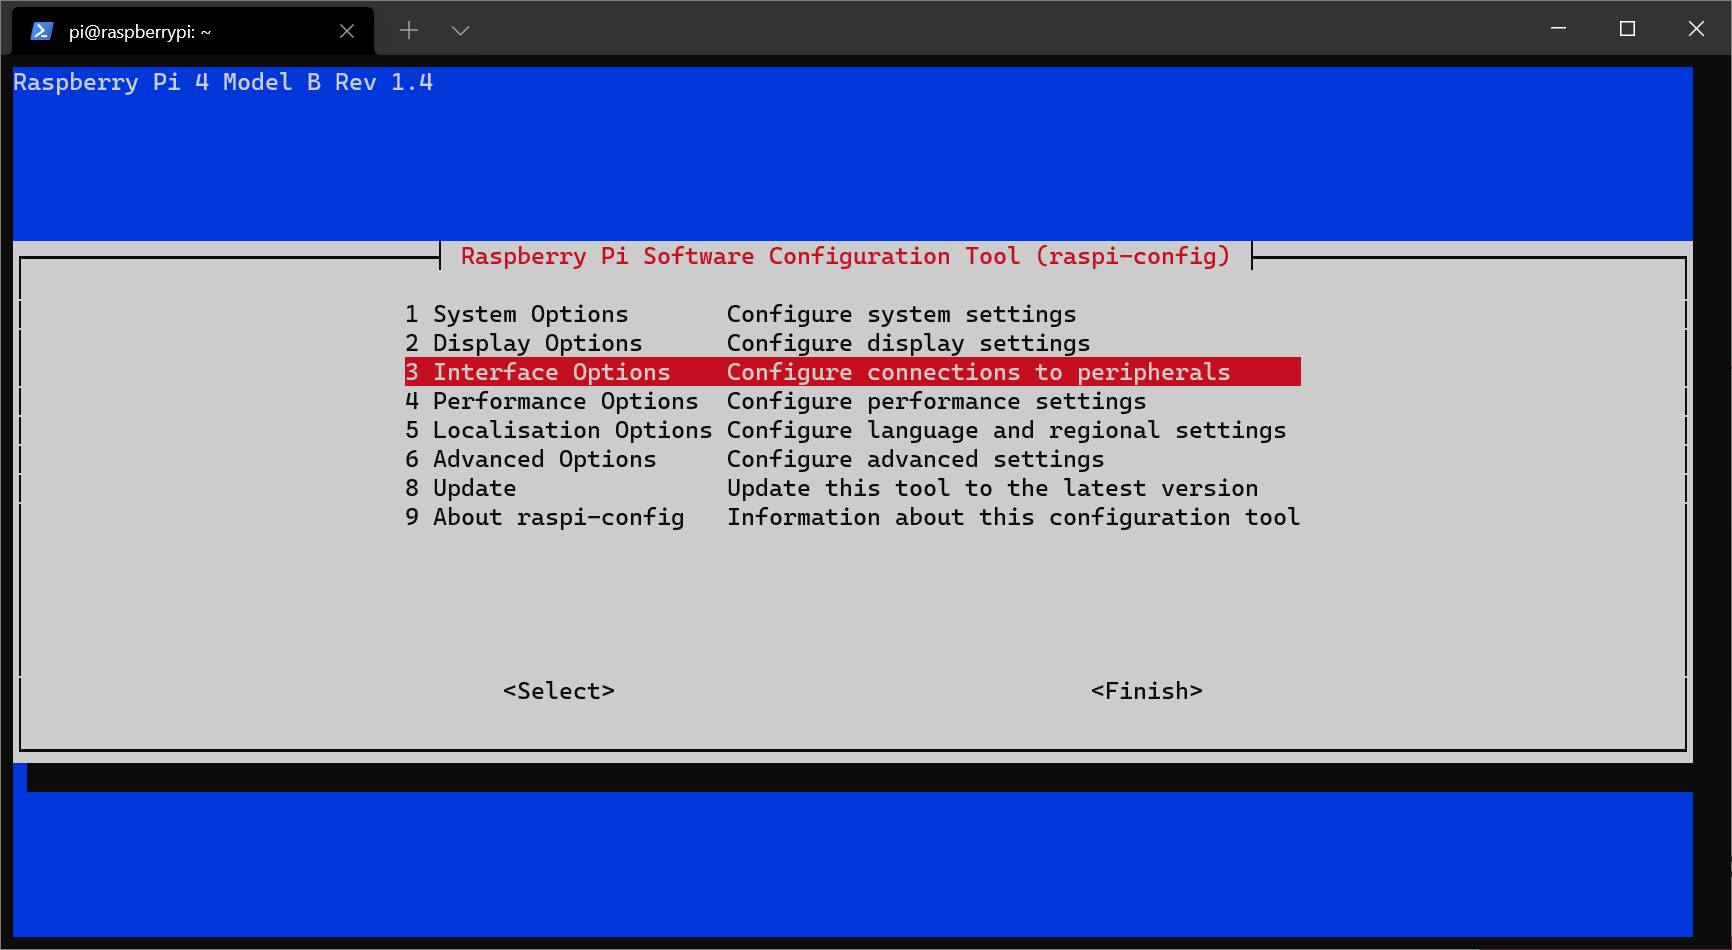
- Select
P2 SSHamd pressENTER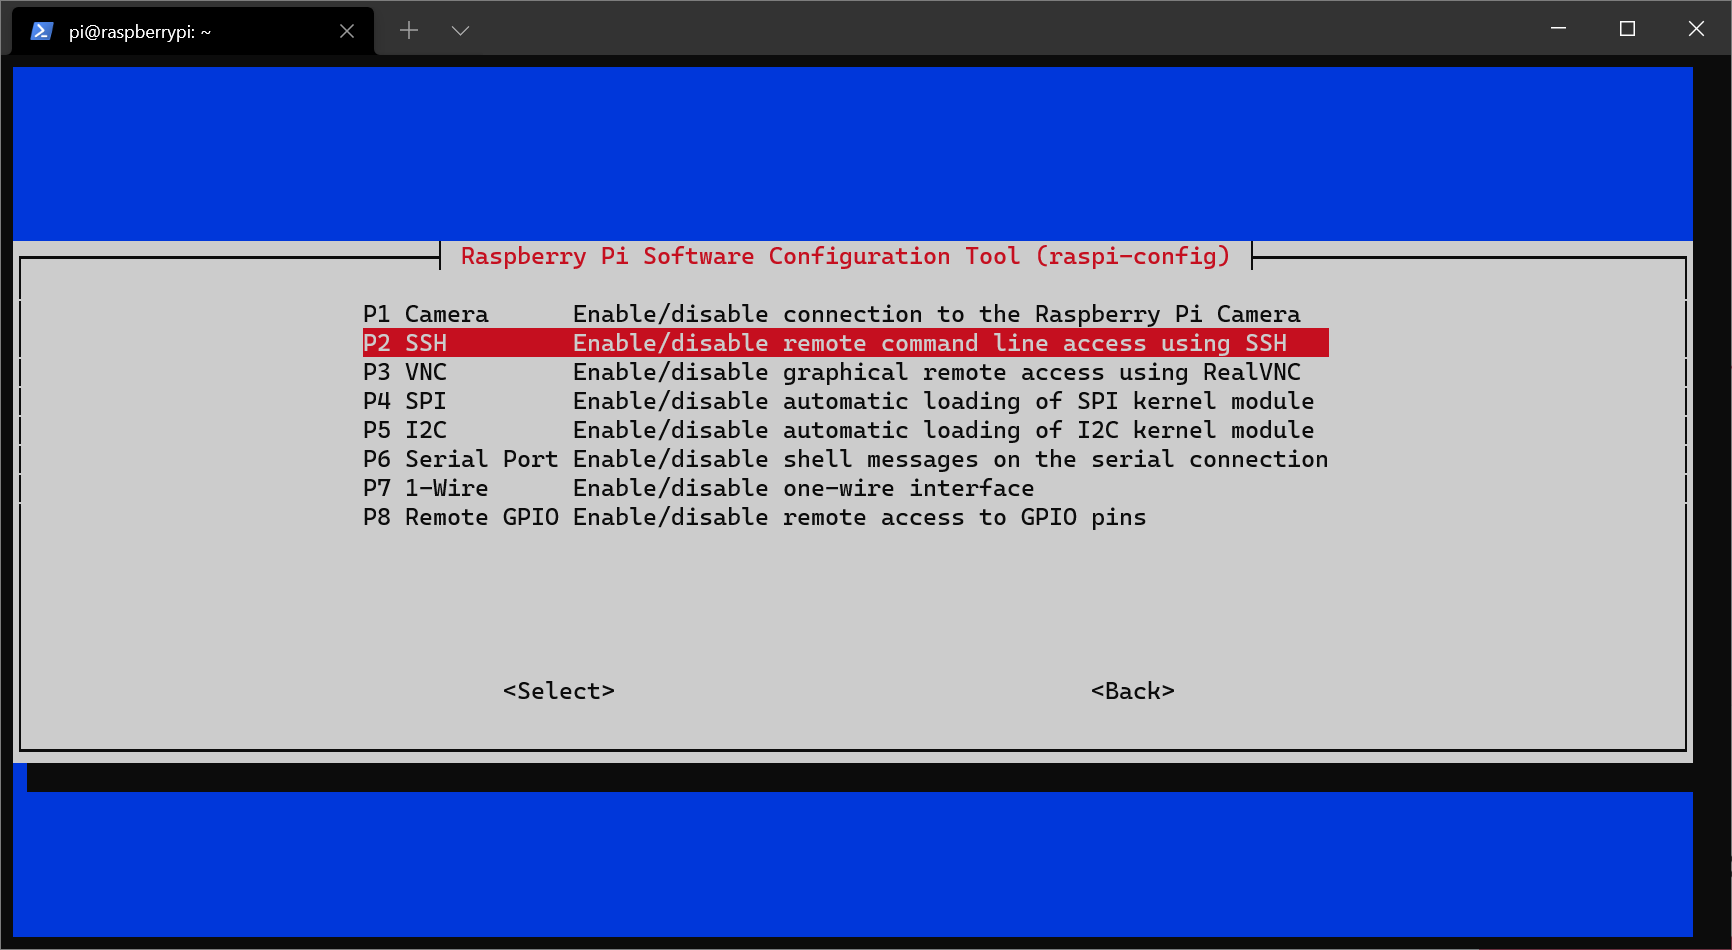
- Selecy
Yesand pressENTER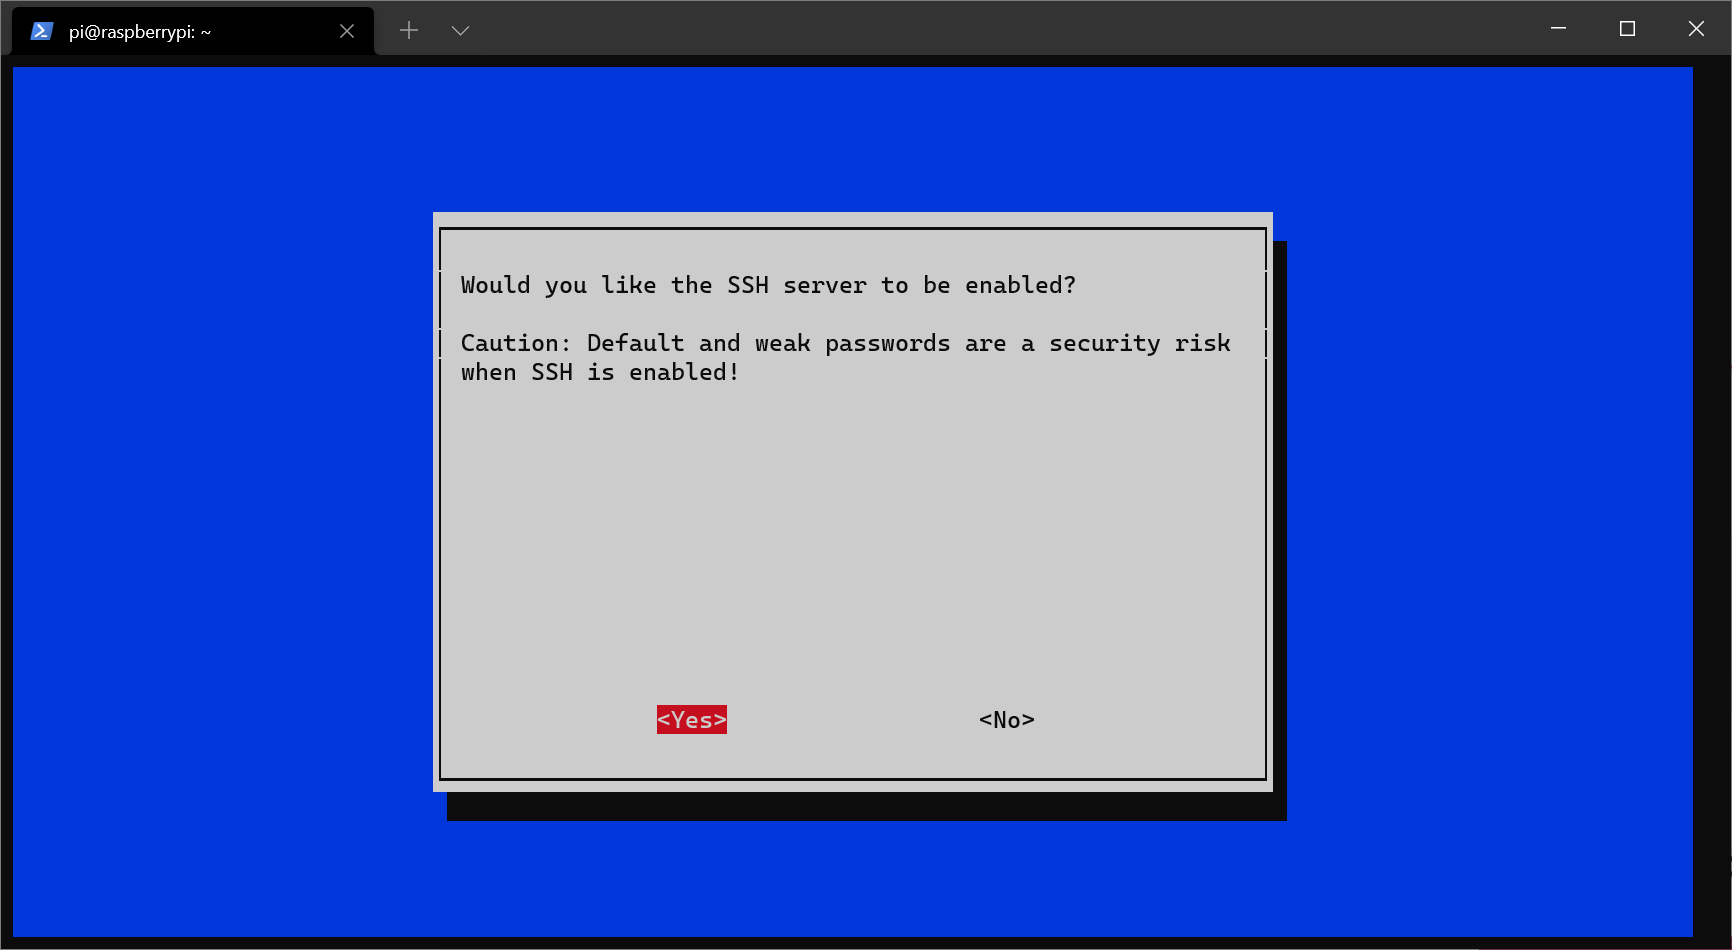
Next, open your terminal and enter ssh pi@raspberrypi and your password.
-
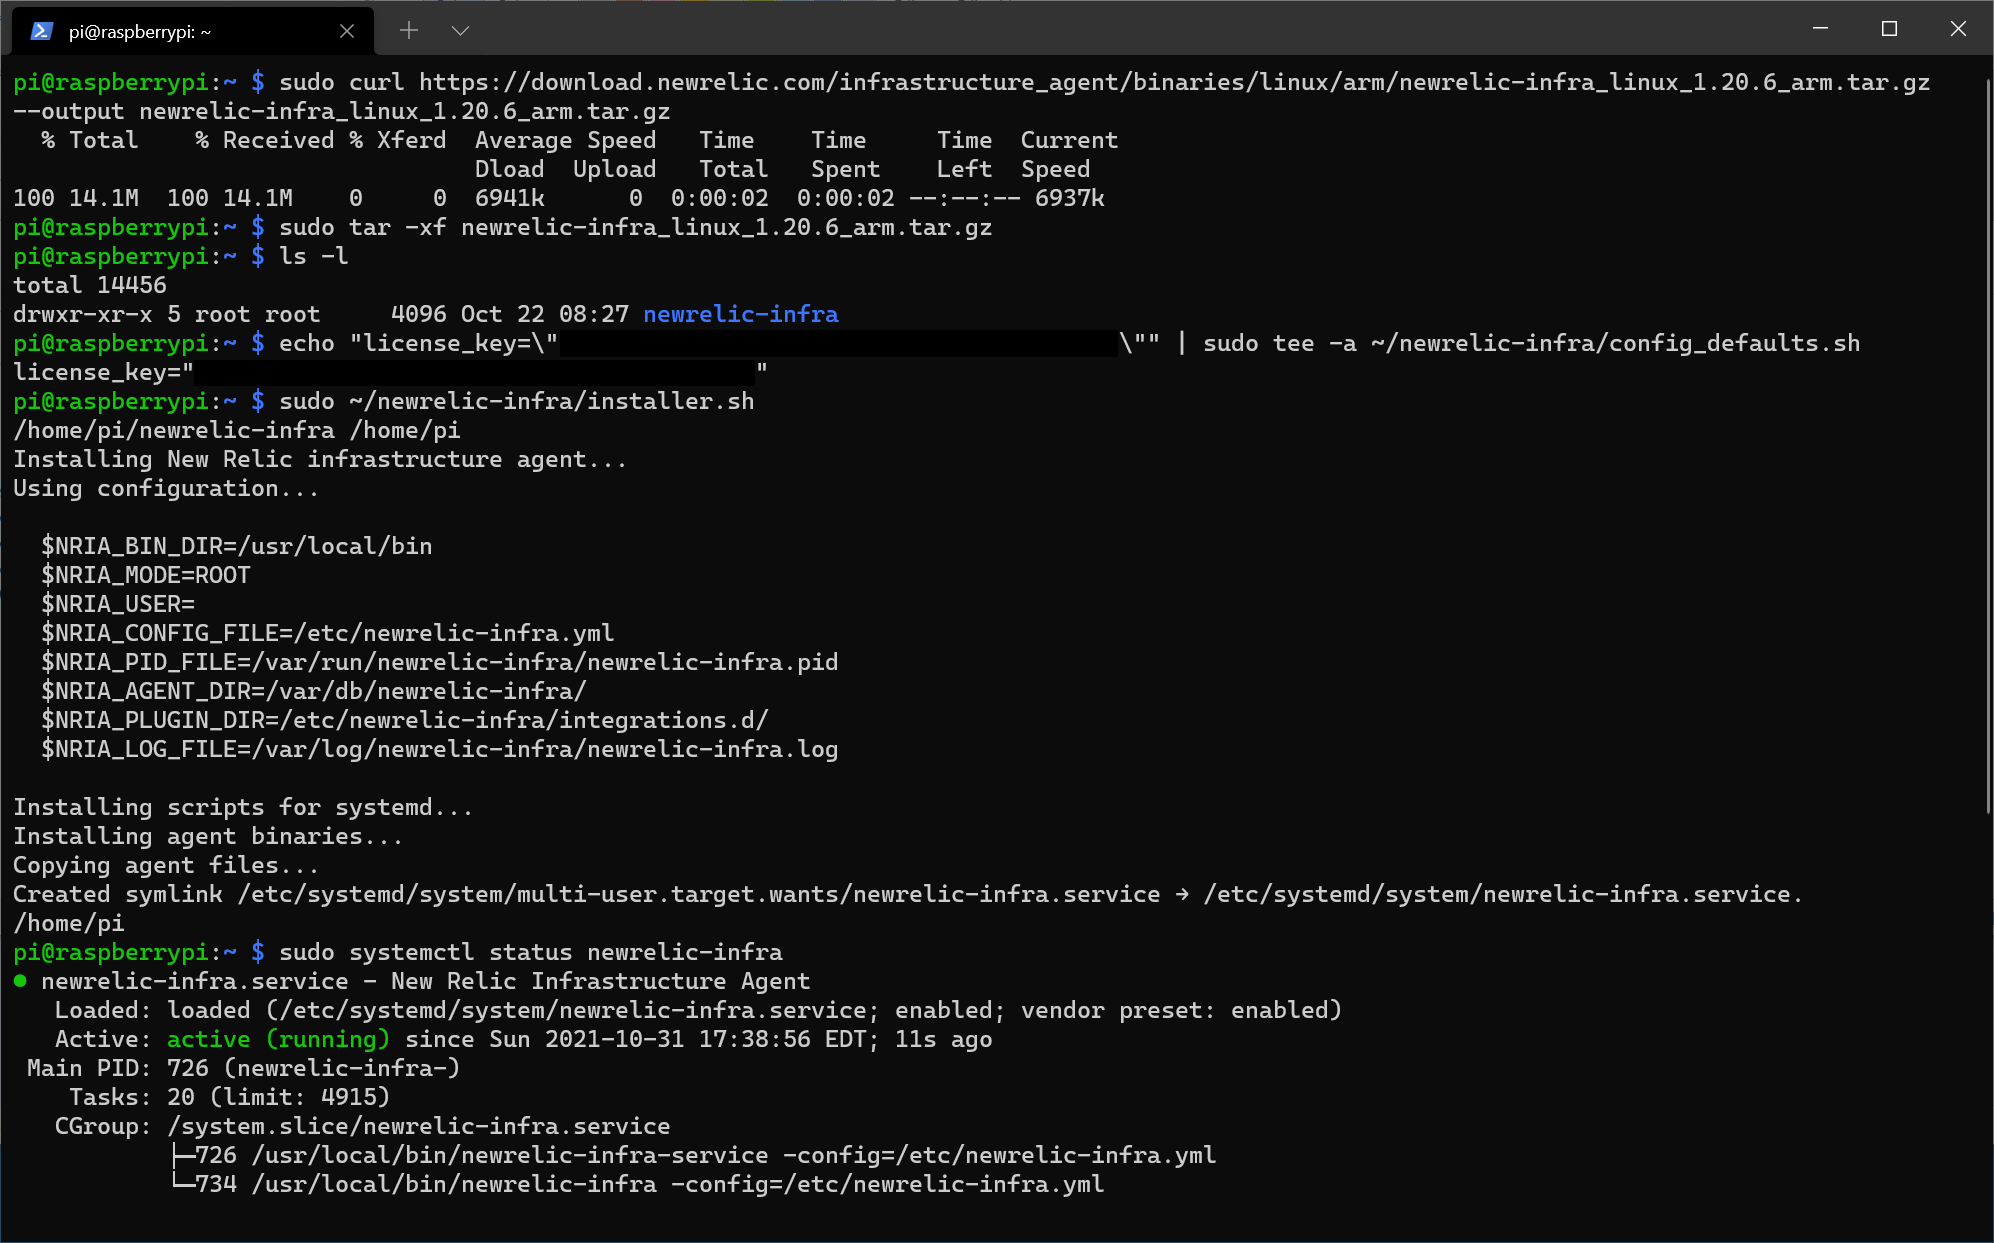
Download New Relic Infrastructure Agent. In this case, my Raspberry Pi 4B uses an ARM Cortex-A72 processor, so we’ll need to download the ARM agent (not AMR64 agent, since our operating system is 32-bit). If you downloaded the ARM64 infrastructure agent and installed that instead, the service fails to start. (ARM and ARM64 variants of the New Relic Infrastructure agent are also available here):
sudo curl https://download.newrelic.com/infrastructure_agent/binaries/linux/arm/newrelic-infra_linux_1.20.6_arm.tar.gz --output newrelic-infra_linux_1.20.6_arm.tar.gz -
Extract:
sudo tar -xf newrelic-infra_linux_1.20.6_arm.tar.gz -
Append your New Relic license key (or edit in
vi,nano, etc.):
echo "license_key=\"a1b2c3d4e5f6g6h7i7j8k9l0m9n8o7p6q5r4NRAL\"" | sudo tee -a ~/newrelic-infra/config_defaults.sh -
Run installer script:
sudo ~/newrelic-infra/installer.sh -
Check if service is running:
sudo systemctl status newrelic-infra -
If service is not running, try restarting:
sudo systemctl restart newrelic-infra
Infrastructure Data Captured
- System
- CPU %
- Load Average
- Memory Free %
- Network
- Transmit Bytes per Second
- Receive Bytes per Second
- Errors per Second
- Processes: Not reported by default.
- To enable,
echo "enable_process_metrics: true" | sudo tee -a /etc/newrelic-infra.ymland restart service
- To enable,
- Storage:
- Disk Used %
- Total Utilization %
- Read/Write Bytes per Second
- Events
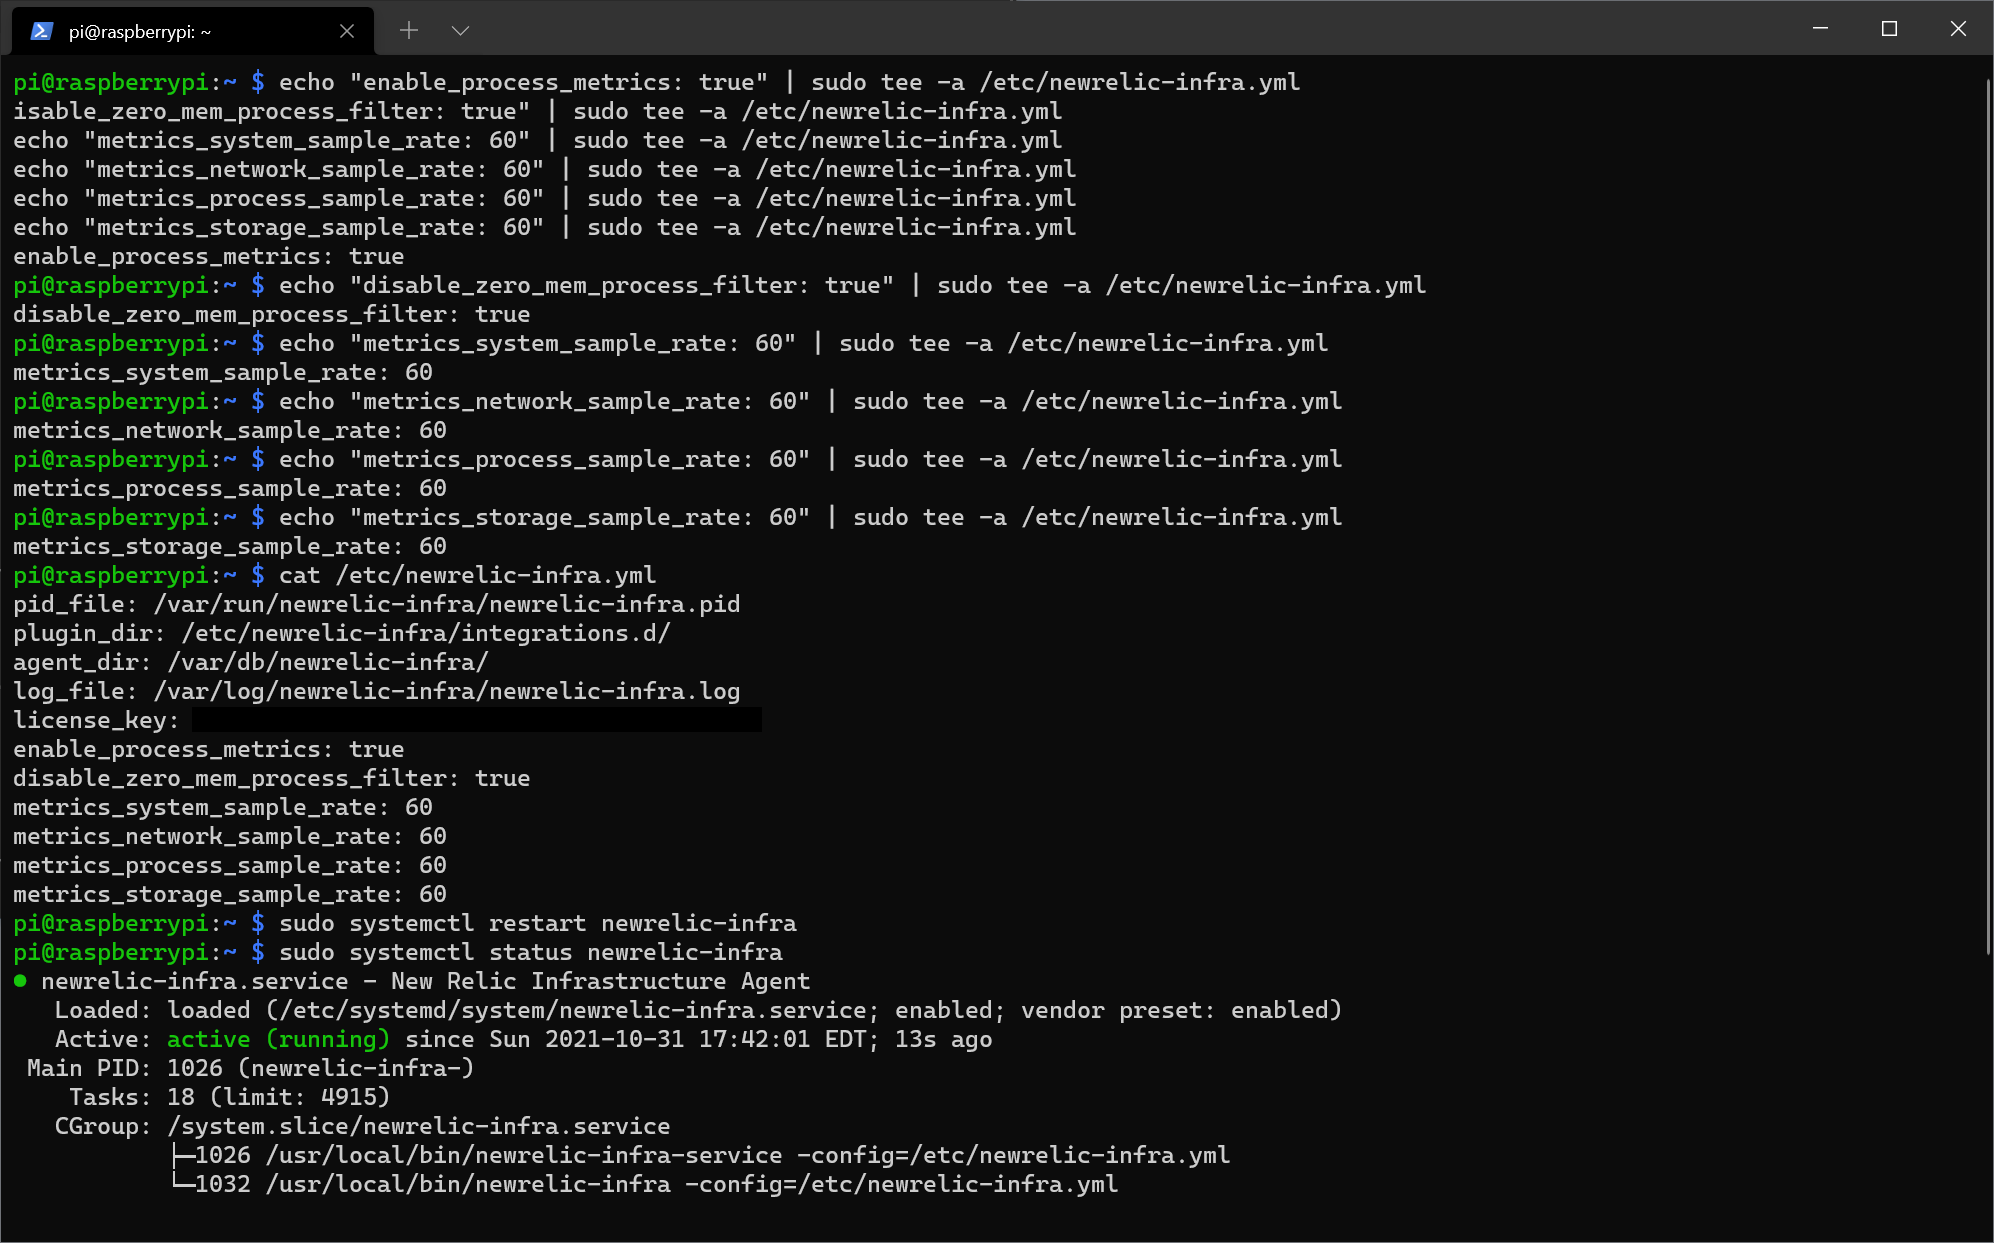
Limit Infrastructure Processes
You may want to configure how frequently samples are taken for infrastructure processes, or limit processors with 0 memory to lower data ingests. Check the New Relic documentation for the default sample rates. The snippit below sets process samples to every 60 seconds.
echo "disable_zero_mem_process_filter: true" | sudo tee -a /etc/newrelic-infra.yml
echo "metrics_system_sample_rate: 60" | sudo tee -a /etc/newrelic-infra.yml
echo "metrics_network_sample_rate: 60" | sudo tee -a /etc/newrelic-infra.yml
echo "metrics_process_sample_rate: 60" | sudo tee -a /etc/newrelic-infra.yml
echo "metrics_storage_sample_rate: 60" | sudo tee -a /etc/newrelic-infra.yml
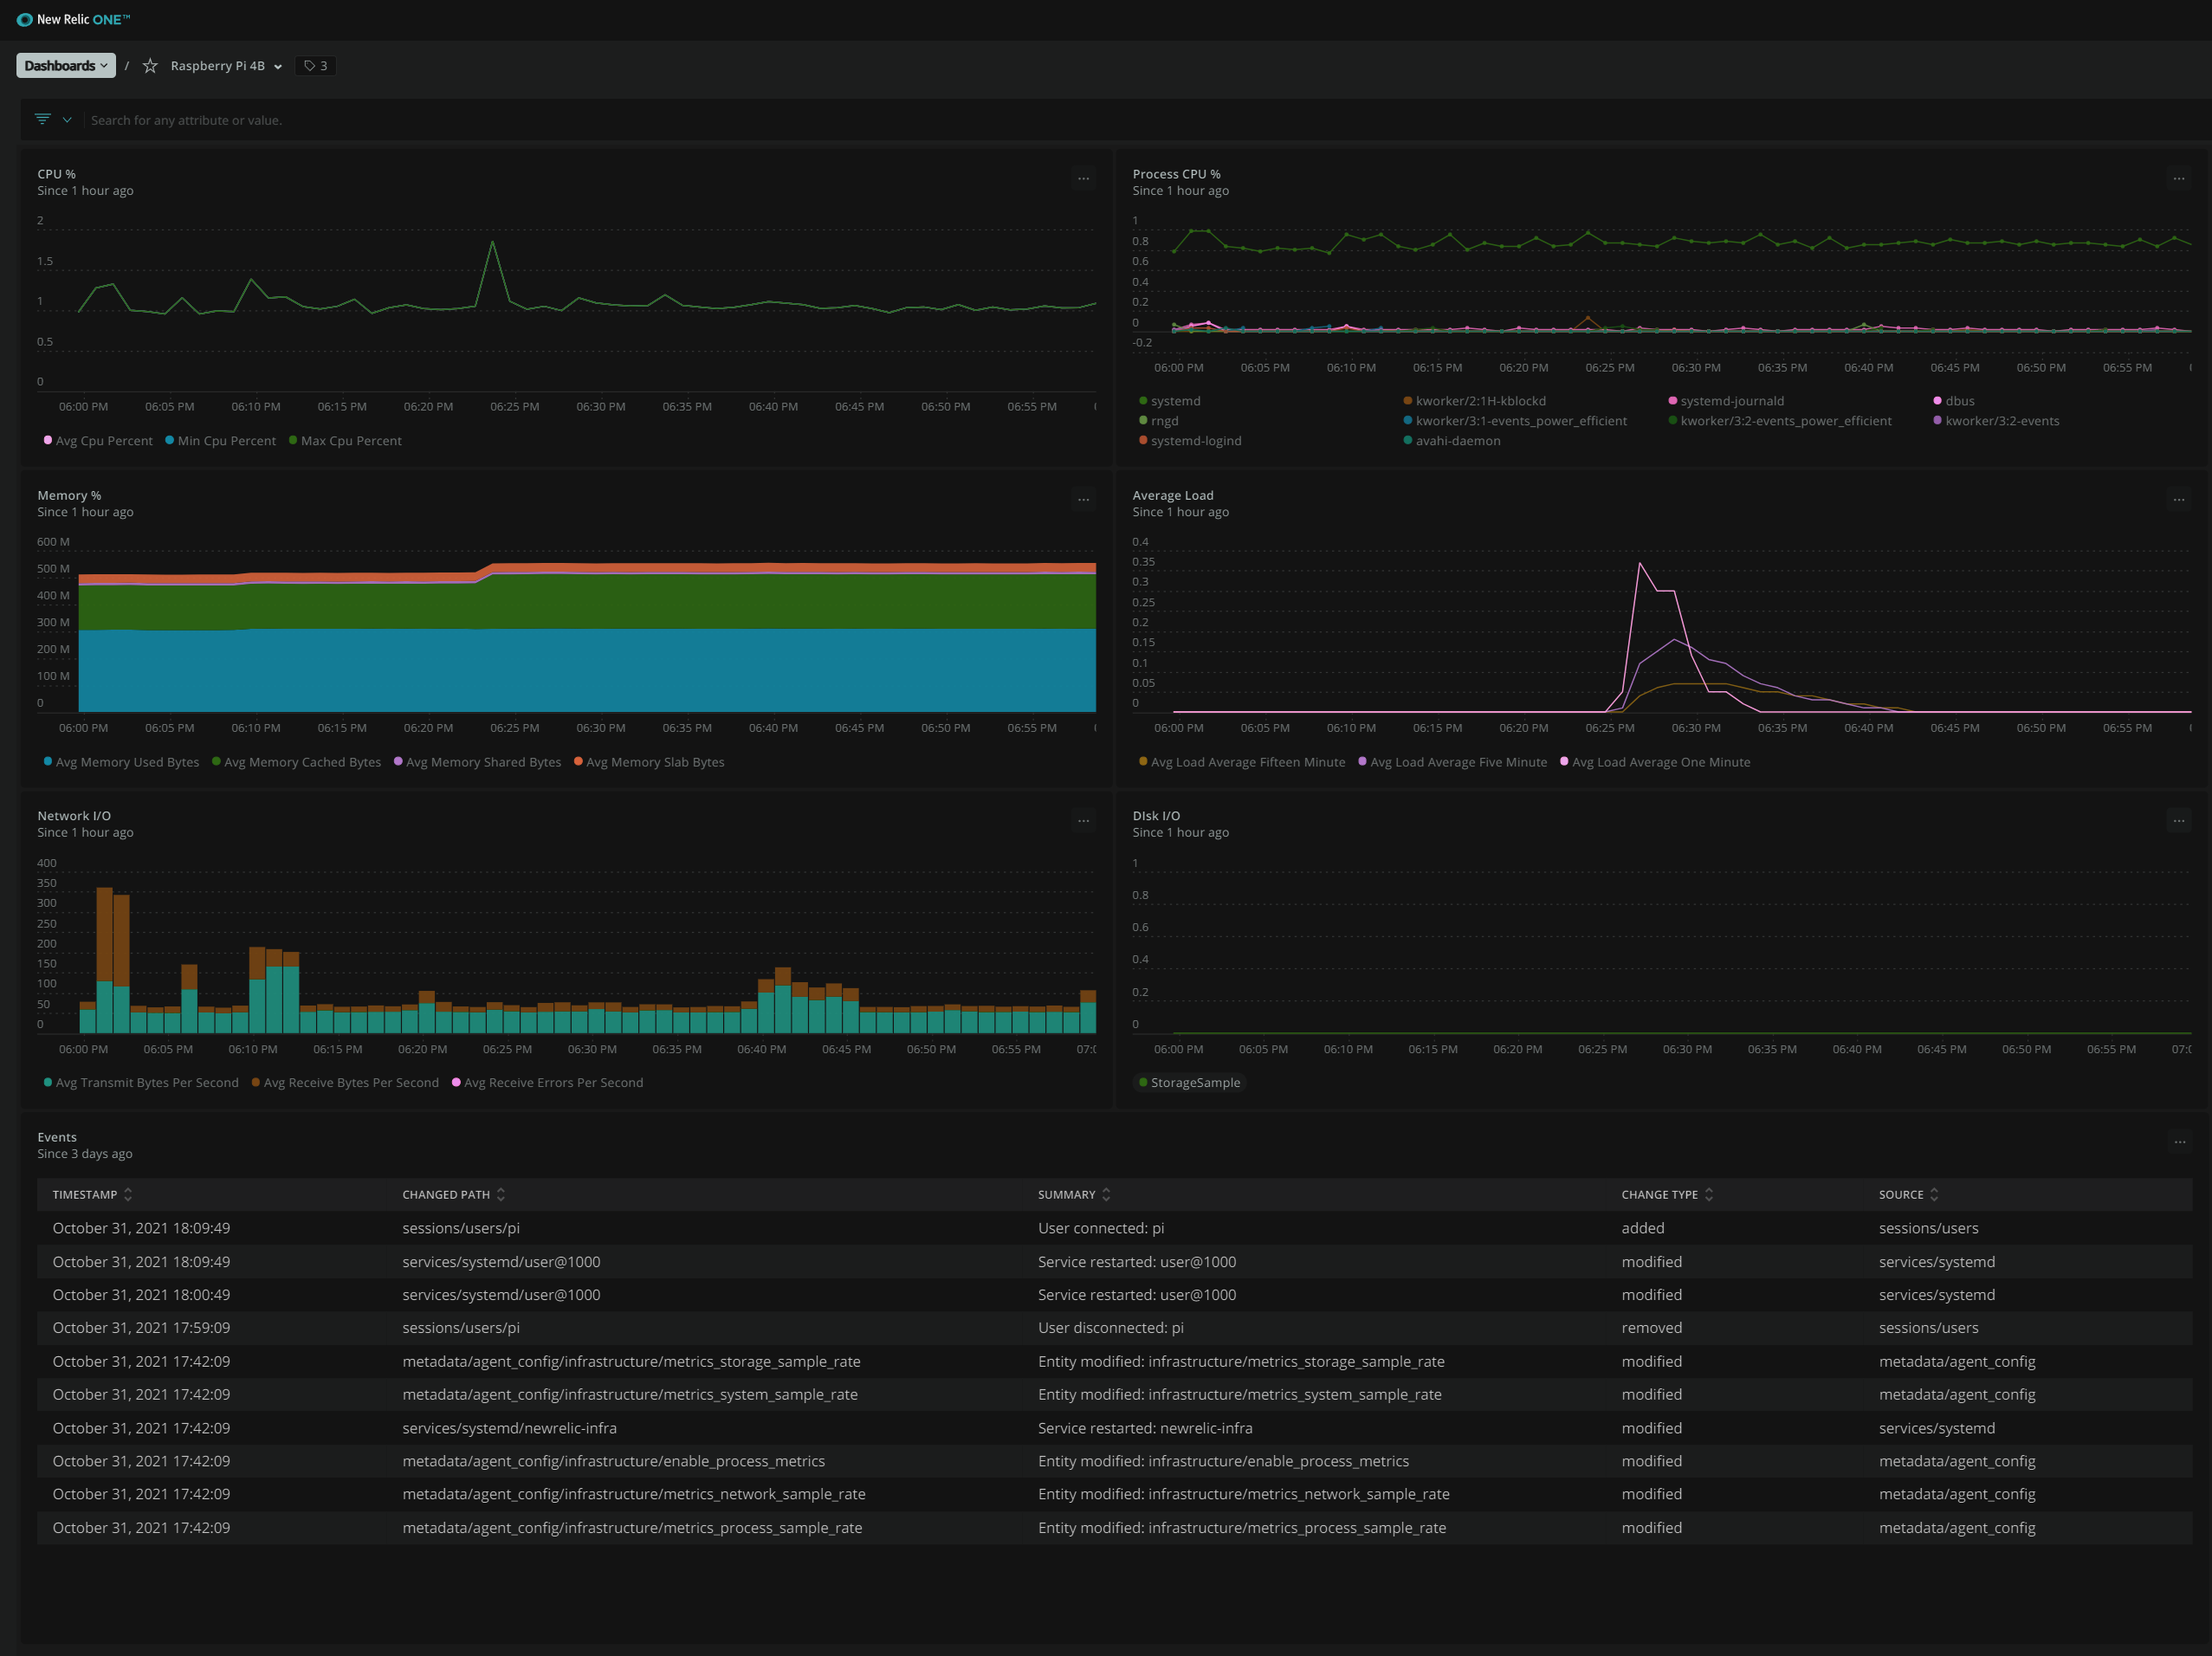
Dashboards
CPU %
Ideally, CPU% min, max, and average should be more or less the same to indicate balanced load.
SELECT average(cpuPercent), min(cpuPercent), max(cpuPercent) FROM SystemSample WHERE entityName = 'raspberrypi' timeseries
Average Load (Five Minutes)
The average load refers to the average number of system processes, threads, or tasks that are waiting and ready for CPU time, in the last 1, 5, 15 minutes.
SELECT average(loadAverageFifteenMinute), average(loadAverageFiveMinute), average(loadAverageOneMinute) FROM SystemSample WHERE entityName = 'raspberrypi' TIMESERIES
Memory % Free
SELECT average(memoryUsedBytes), average(memoryCachedBytes), average(memorySharedBytes), average(memorySlabBytes) FROM SystemSample WHERE entityName = 'raspberrypi' TIMESERIES
Disk % Usage
SELECT average(diskUsedPercent) FROM StorageSample WHERE entityName = 'raspberrypi' FACET entityAndMountPoint TIMESERIES
Disk I/O
SELECT average(readWriteBytesPerSecond OR readBytesPerSecond+writeBytesPerSecond) FROM StorageSample WHERE hostname = 'raspberrypi' FACET entityAndMountPoint TIMESERIES
Network I/O
SELECT average(transmitBytesPerSecond), average(receiveBytesPerSecond), average(receiveErrorsPerSecond) FROM NetworkSample WHERE entityName = 'raspberrypi' TIMESERIES
Events
SELECT changedPath, summary, changeType, source FROM InfrastructureEvent WHERE entityName = 'raspberrypi' SINCE 72 HOURS AGO
Processes
SELECT max(cpuPercent) FROM ProcessSample WHERE entityName = 'raspberrypi' AND processDisplayName != 'newrelic-infra' FACET processDisplayName TIMESERIES
Otherwise, import this dashboard to your New Relic One account without creating these manually: