Monitoring Heroku Apps with New Relic
For this example, I have a simple Flask application called datacrunch-consulting that is deployed to Heroku via GitHub integration. Starting with GitHub, you can create a repository. Then, use GitHub Desktop to clone/push code back to GitHub without using the command line. Linking the repository with Heroku allows the application to deploy every time a push is made to your repository, great for continuous integration / continus deployment.
See GitHub repository here: https://github.com/pnvnd/flaskapp or use your own Heroku app.
We’ll need to make some adjustments to your Heroku Procfile:
newrelic-admin run-program gunicorn -b "0.0.0.0:$PORT" -w 3 --chdir datacrunch-consulting webserver:flaskapp
We’ll go over how to setup the following in New Relic One:
- Application Performance Monitoring (APM) for golden signals
- Browser for Real User Monitoring (RUM)
- Synthetics ping check for application uptime
- Logs for distributed tracing
- Alerts to notifiy when threshold conditions are met
New Relic APM Setup
- Log into Heroku and verify your account by adding a payment method
- Go to Heroku Add-ons and select
New Relic APM - Add-on plan:
Wayne - Free - App to provision to
datacrunch-consulting - Click
Submit Order Form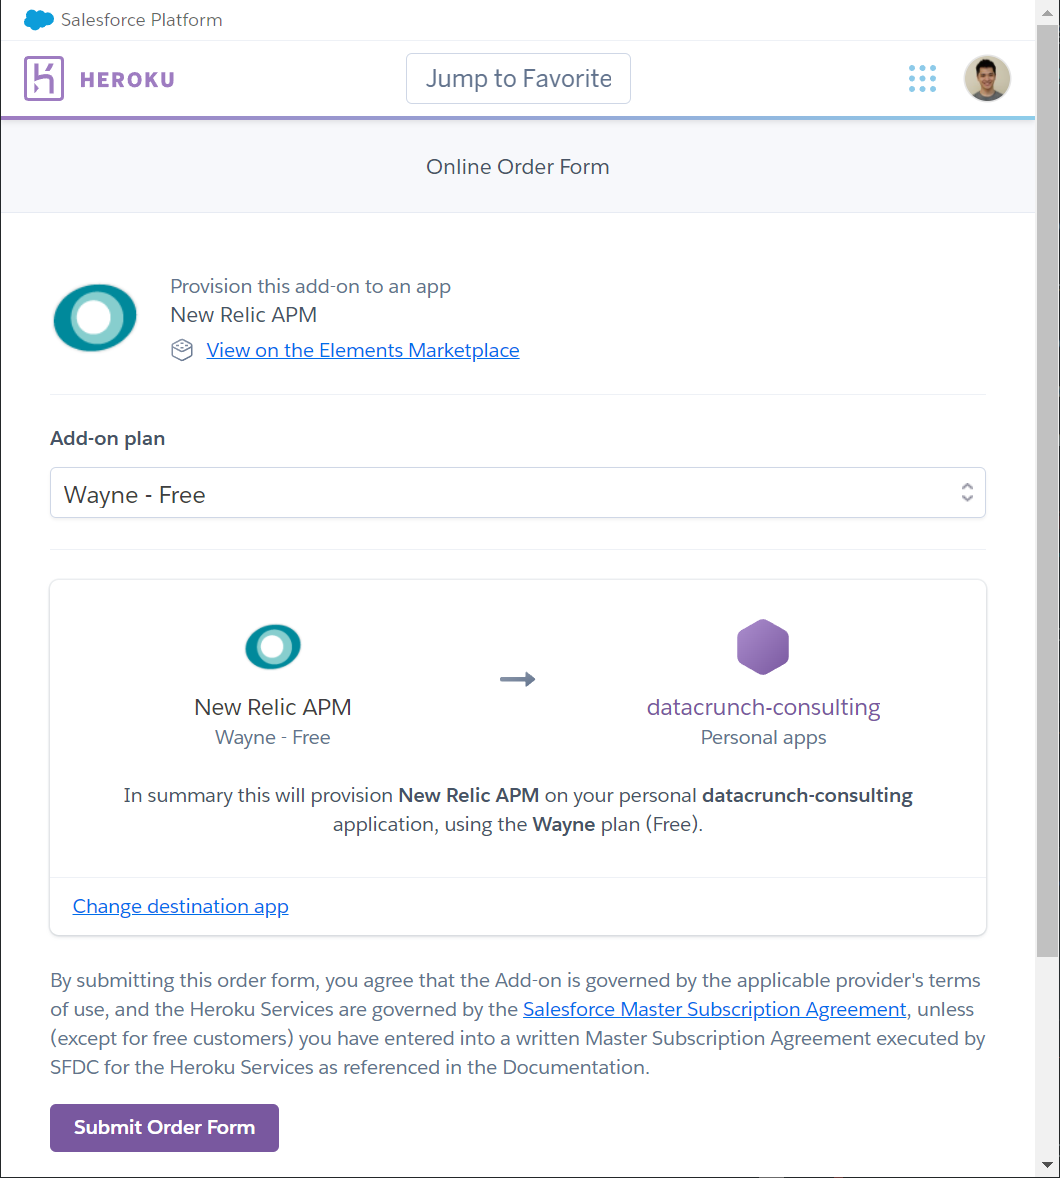
- Wait for the add-on to install. Note: it’ll create an account for you, even you already have one. We’ll need to configure the environment variables to send APM data to the correct account.
- In your Heroku dashboard, click on the the app with the New Relic APM add-on
- Click on Settings > Config Vars >
Reveal Config Vars - You should see at least three (3) configuration variables. If not, add them manually:
NEW_RELIC_APP_NAMENEW_RELIC_LICENSE_KEYNEW_RELIC_LOG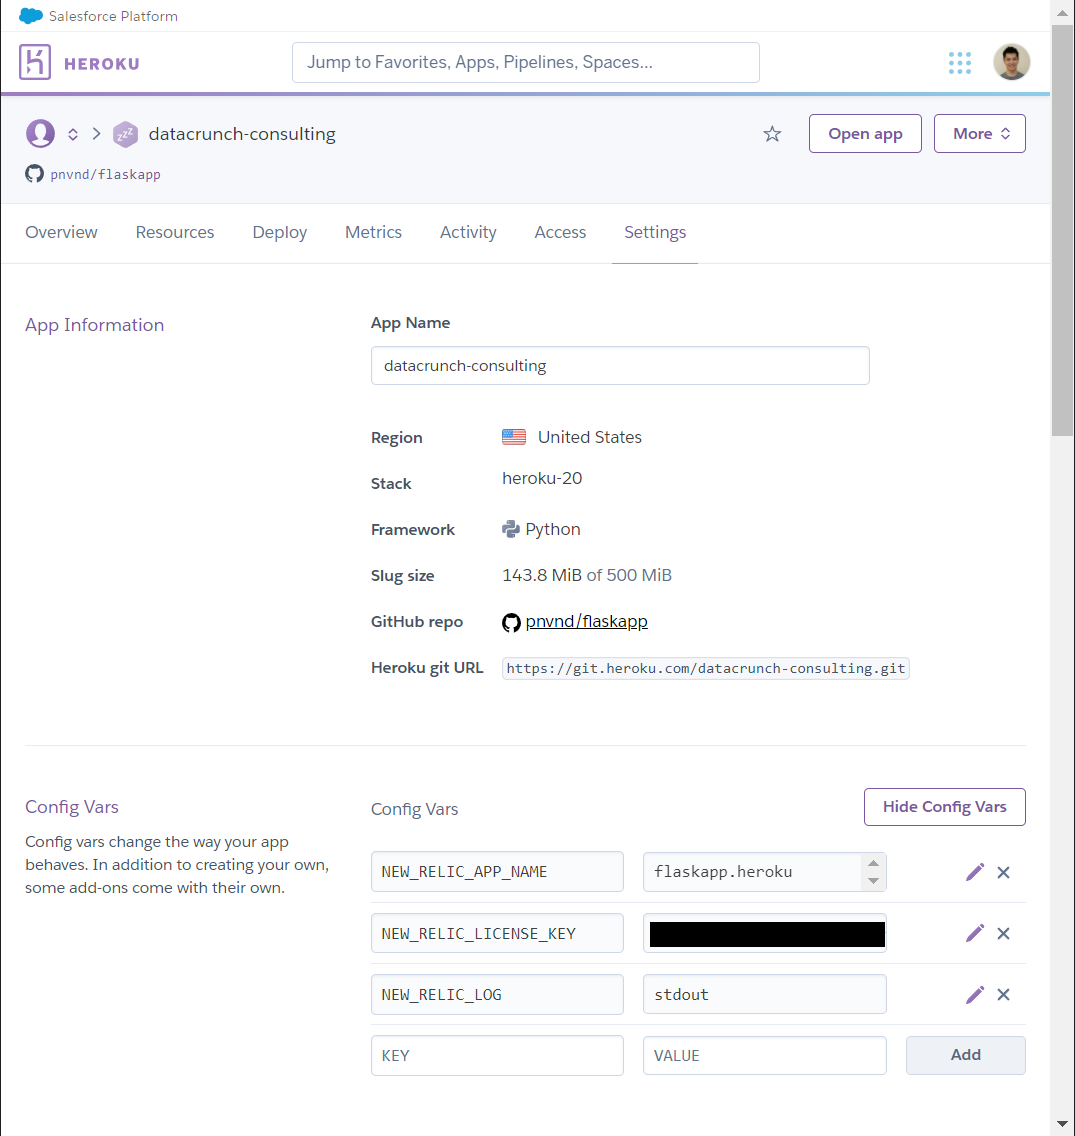
- Edit the
NEW_RELIC_APP_NAMEto give your application a name. This is what shows up in New Relic.
You also can edit this in New Relic One > APM > Settings > Application > Application Settings > Application alias - Edit
NEW_RELIC_LICENSE_KEYto have the license key for the New Relic account you want data ingested into - Restart your application by toggling off/on your dynos in Heroku > Resources
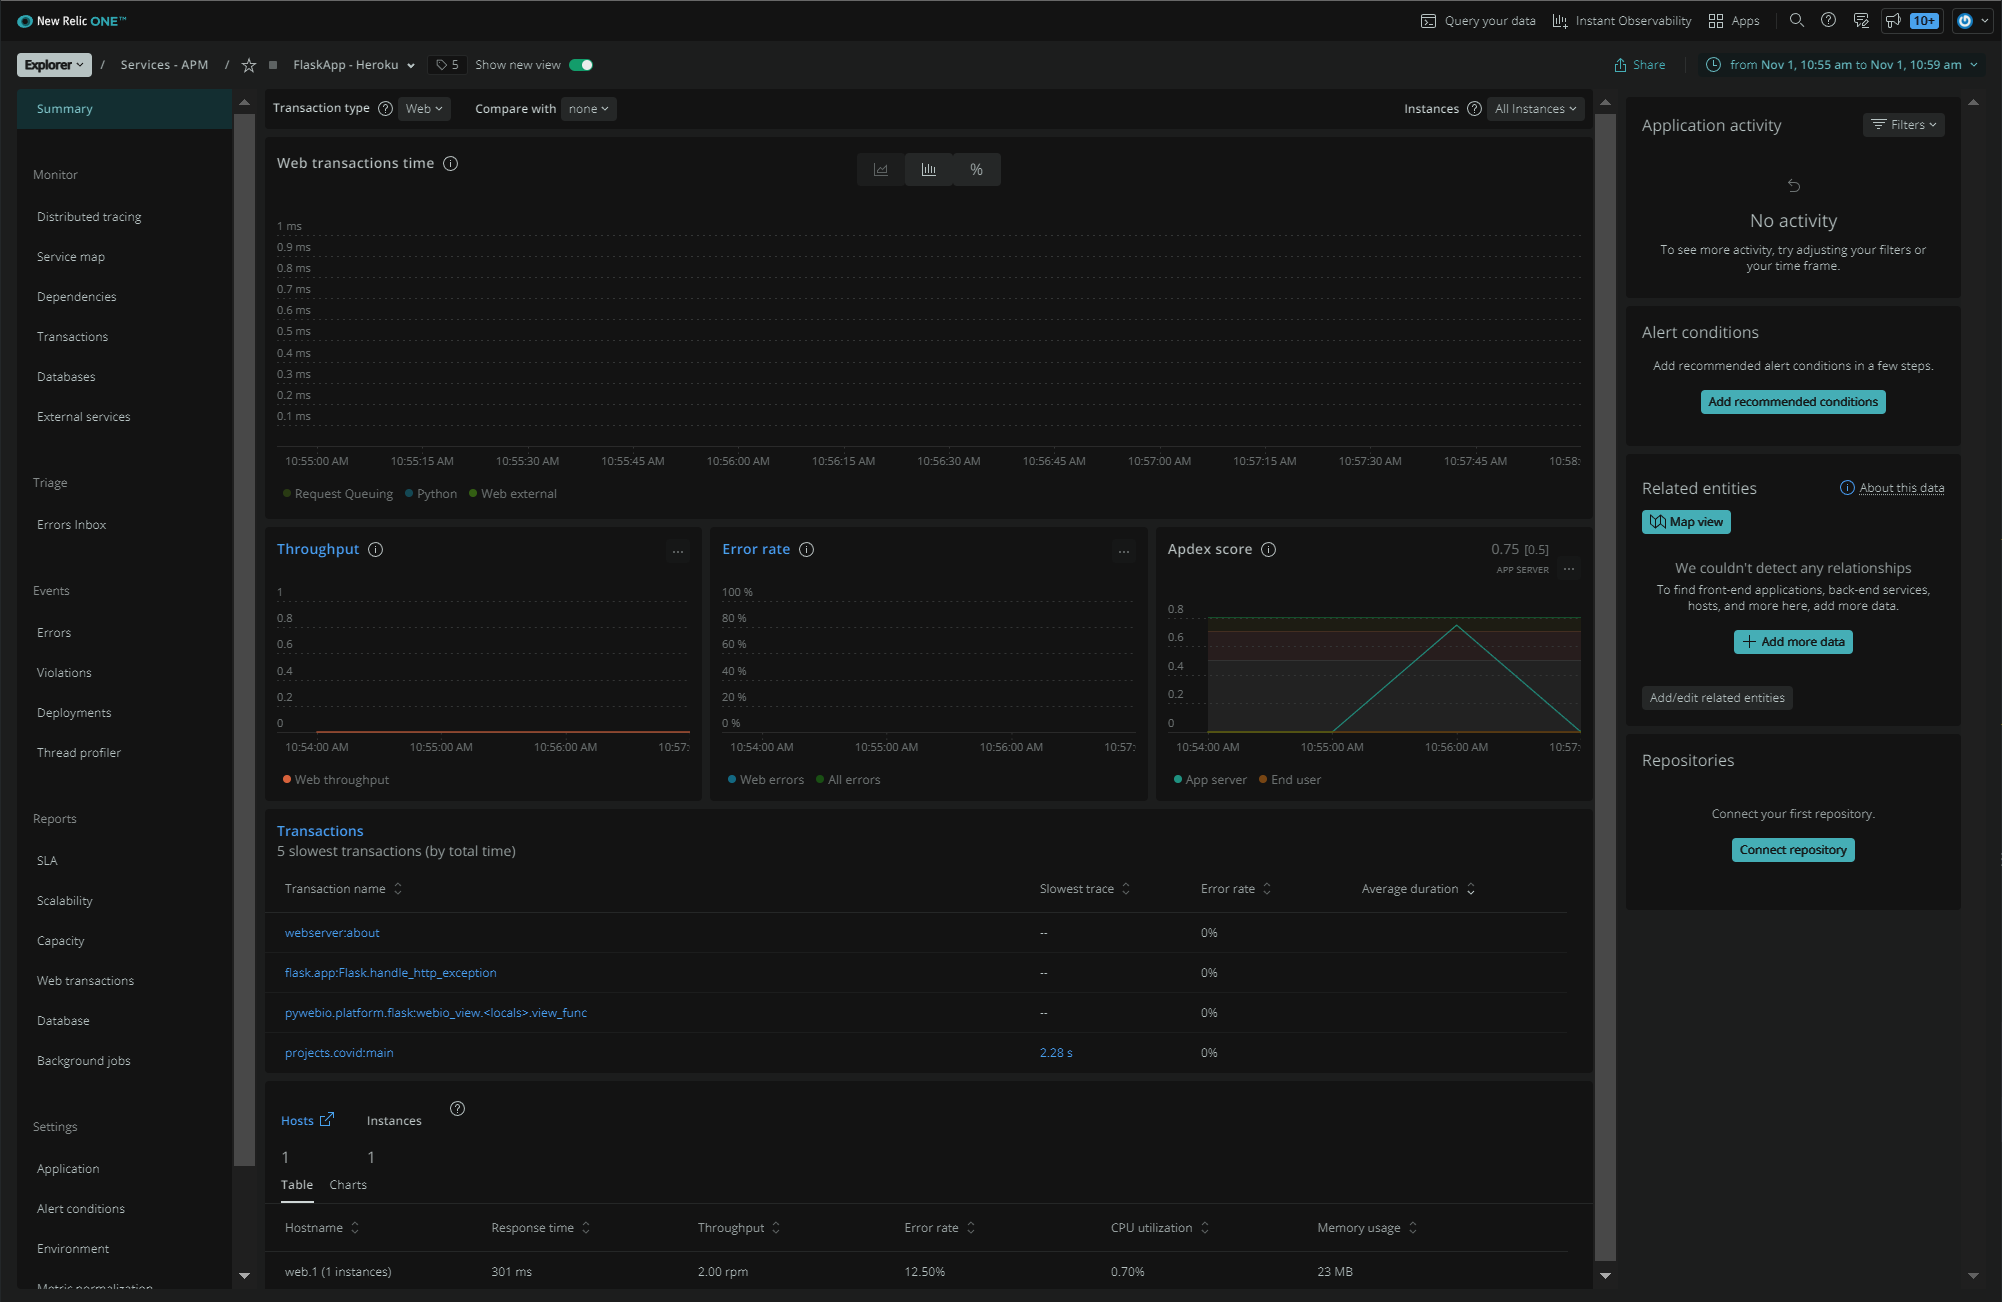
- Go to your deployed Heroku app and log into New Relic One and check APM for data ingested.
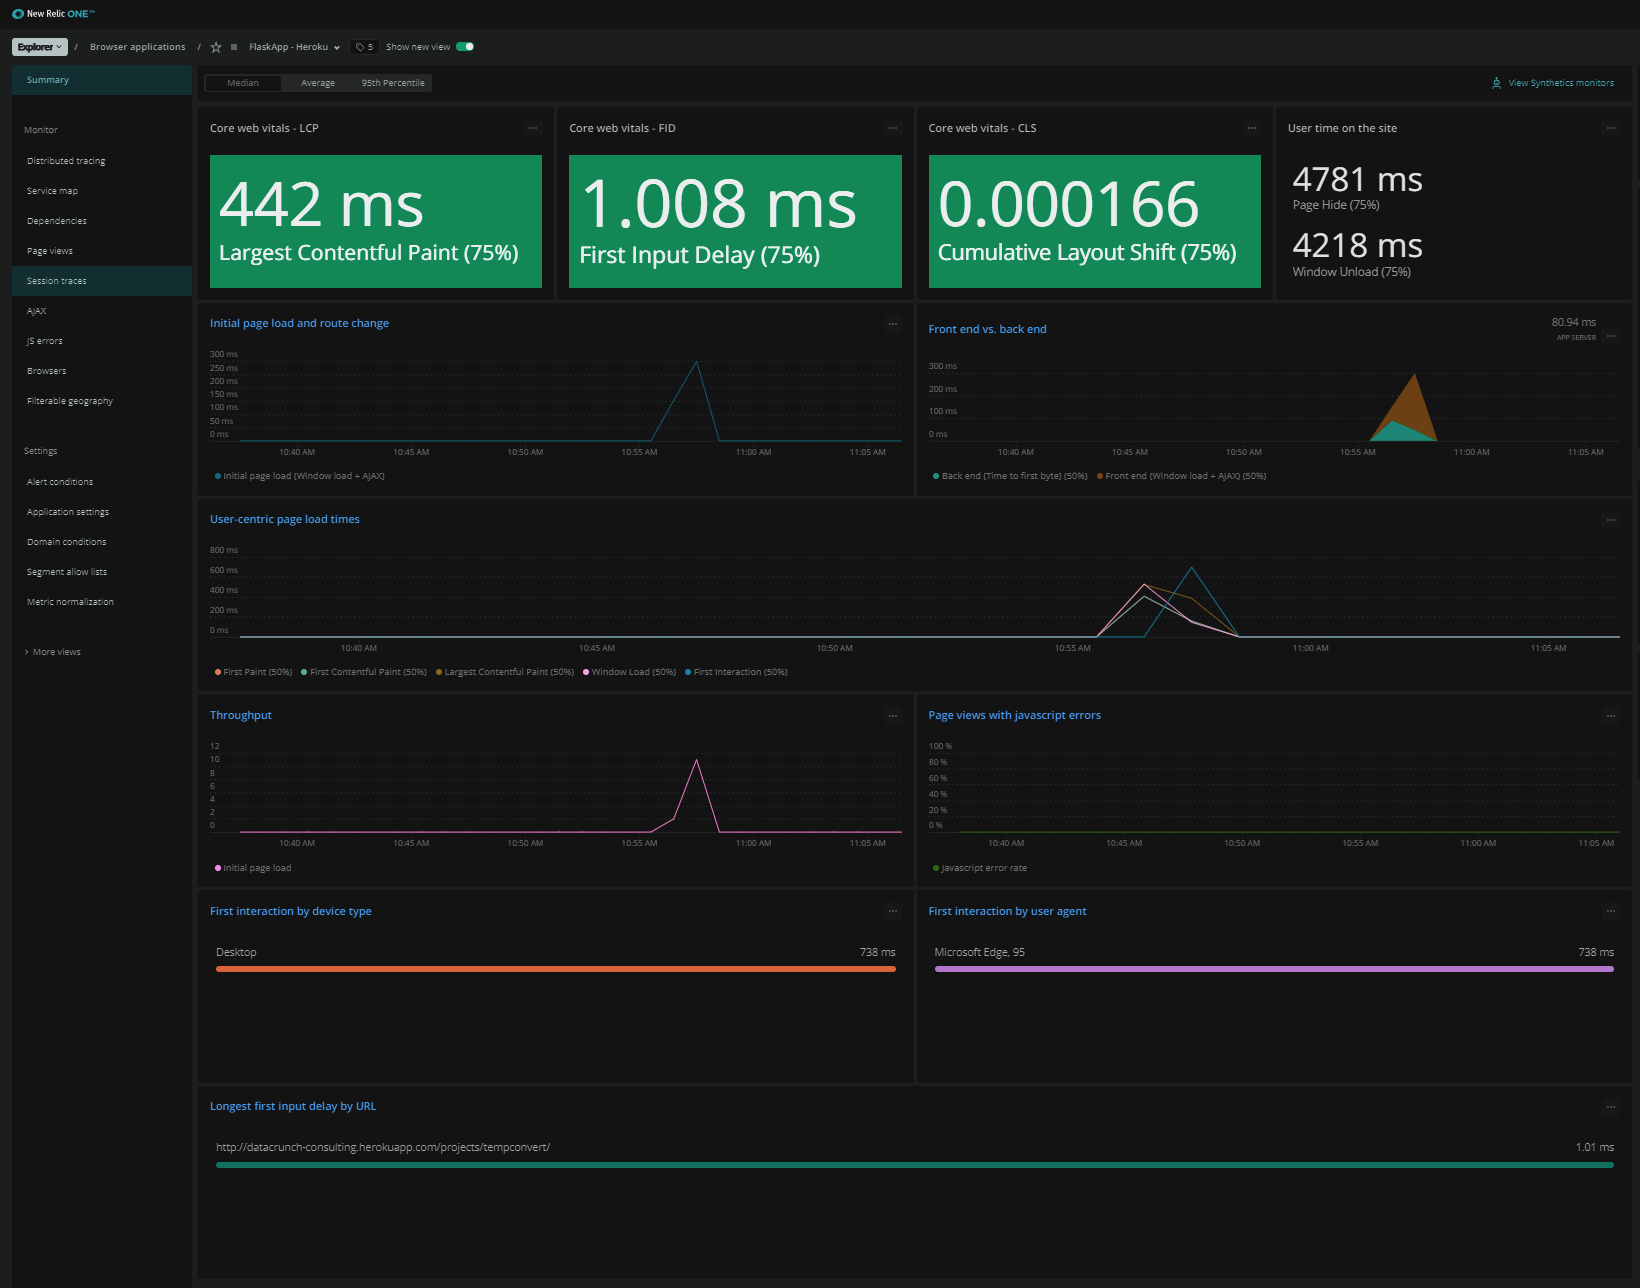
New Relic Browser Setup
With the APM agent installed on Heroku, you can get Real User Monitoring to track browser sessions, which browser is being used, which landing page the user is getting errors (if any), and geographical location of your users.
- In New Relic One, click
Add more dataon the top-right and select ` Browser Metrics` - Select
Enable via New Relic APMand select your application from the selection box.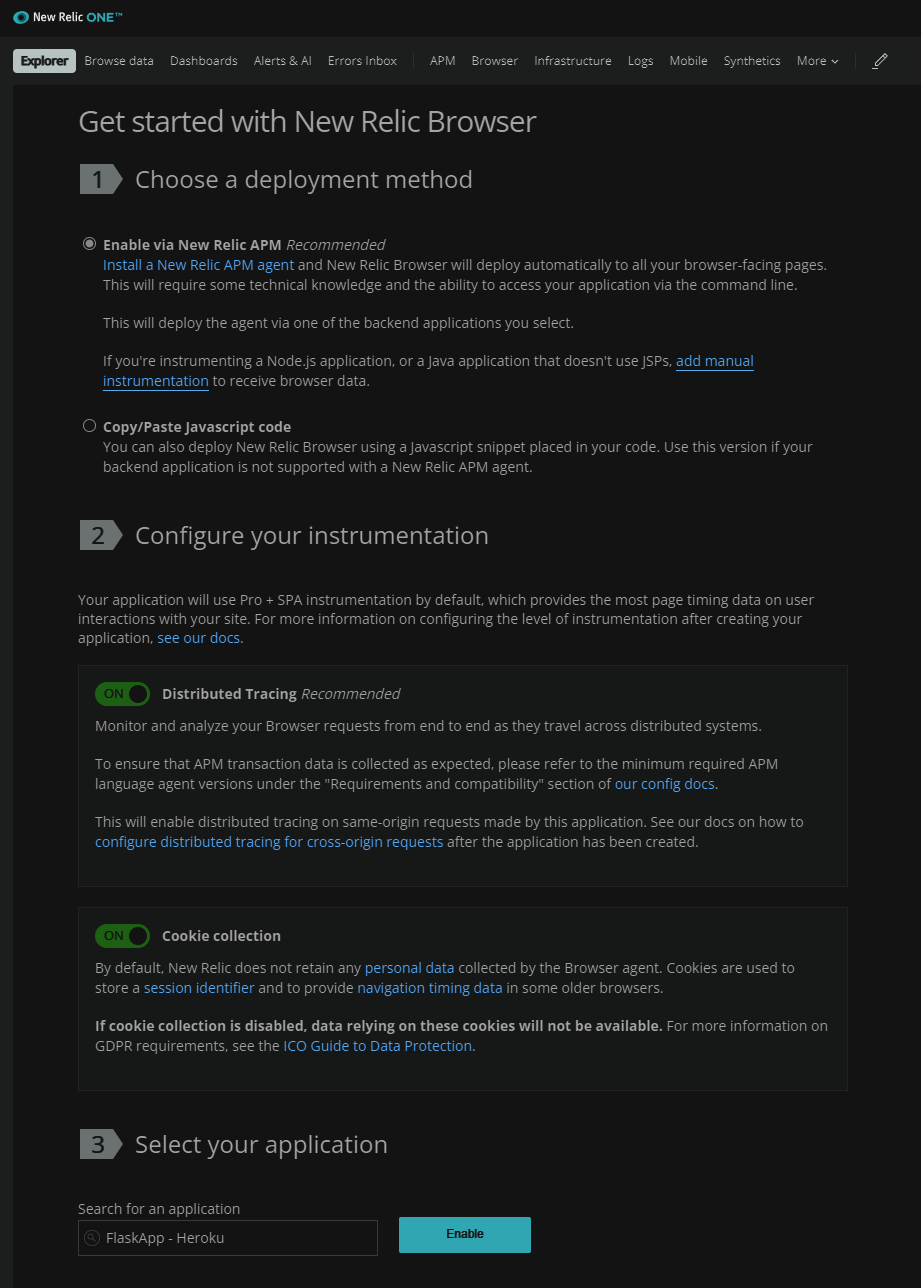
- Once enabled, go to your Heroku app to get data ingested. Note: Some adblockers prevent JavaScript from running in the background.
New Relic Synthetics Setup
Heroku apps on the free tier shuts down the app after 30 minutes of inactivity. When someone accesses the Heroku app after inactivity, it will cold start and may take a minute to load. Having a simple synthetics ping test every 15 minutes will keep the Heroku app up to avoid “cold starts”.
- Go to New Relic One > Synthetics
- Add monitor by giving it a name
- For
Text validation (optional), add a stringWelcome!(or whatever string that appears on your endpoint) - Advanced options: enable
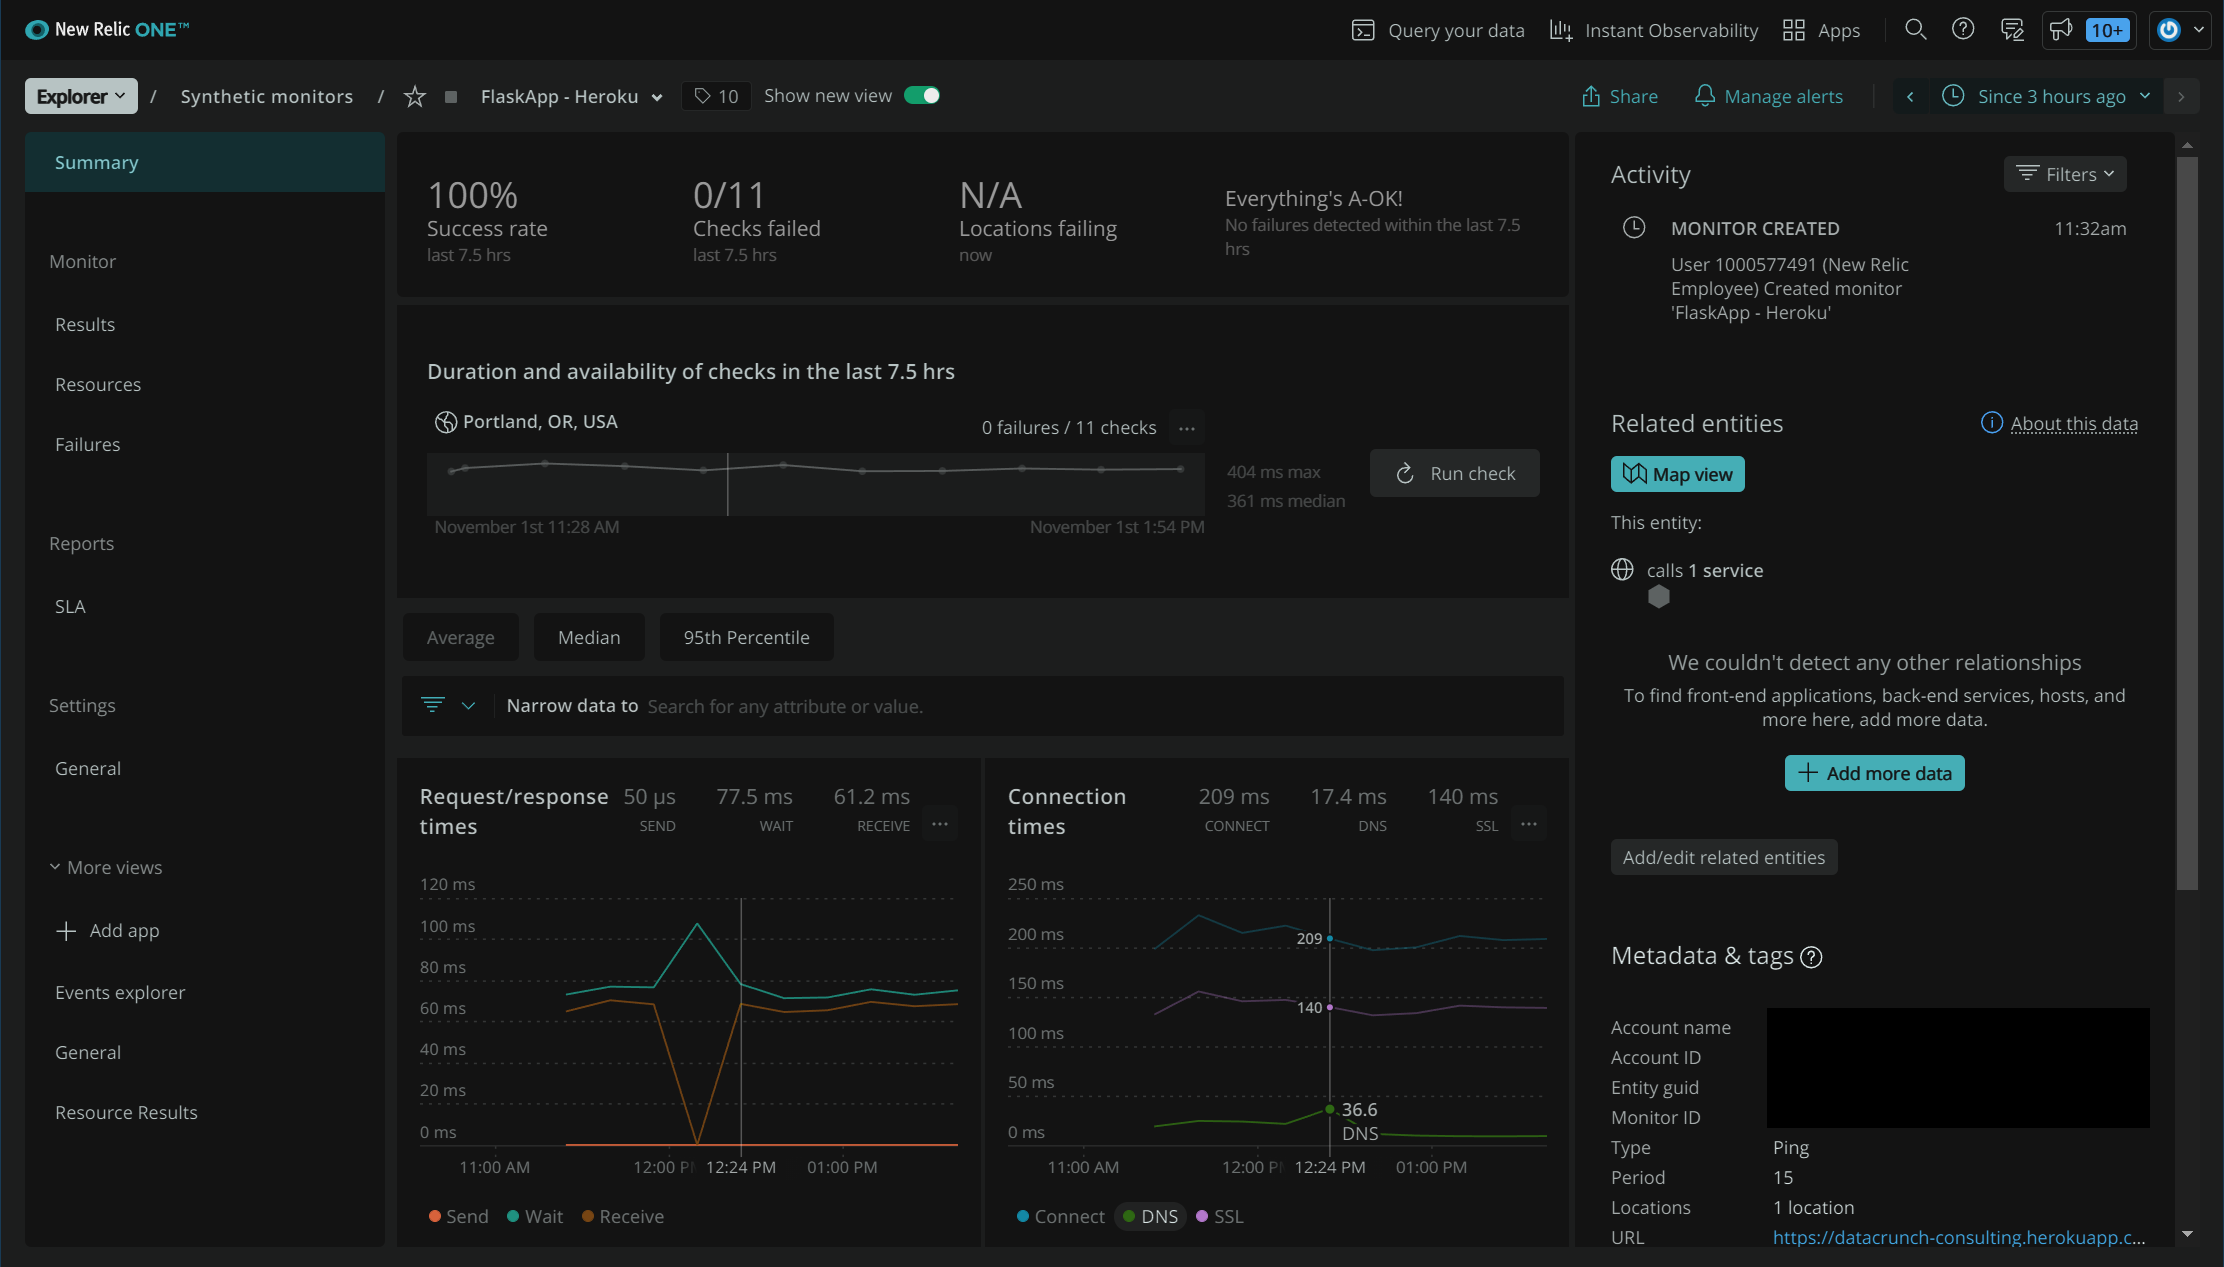
Verify SSLto check for expired certificates - Check 1 location, every 15 minutes
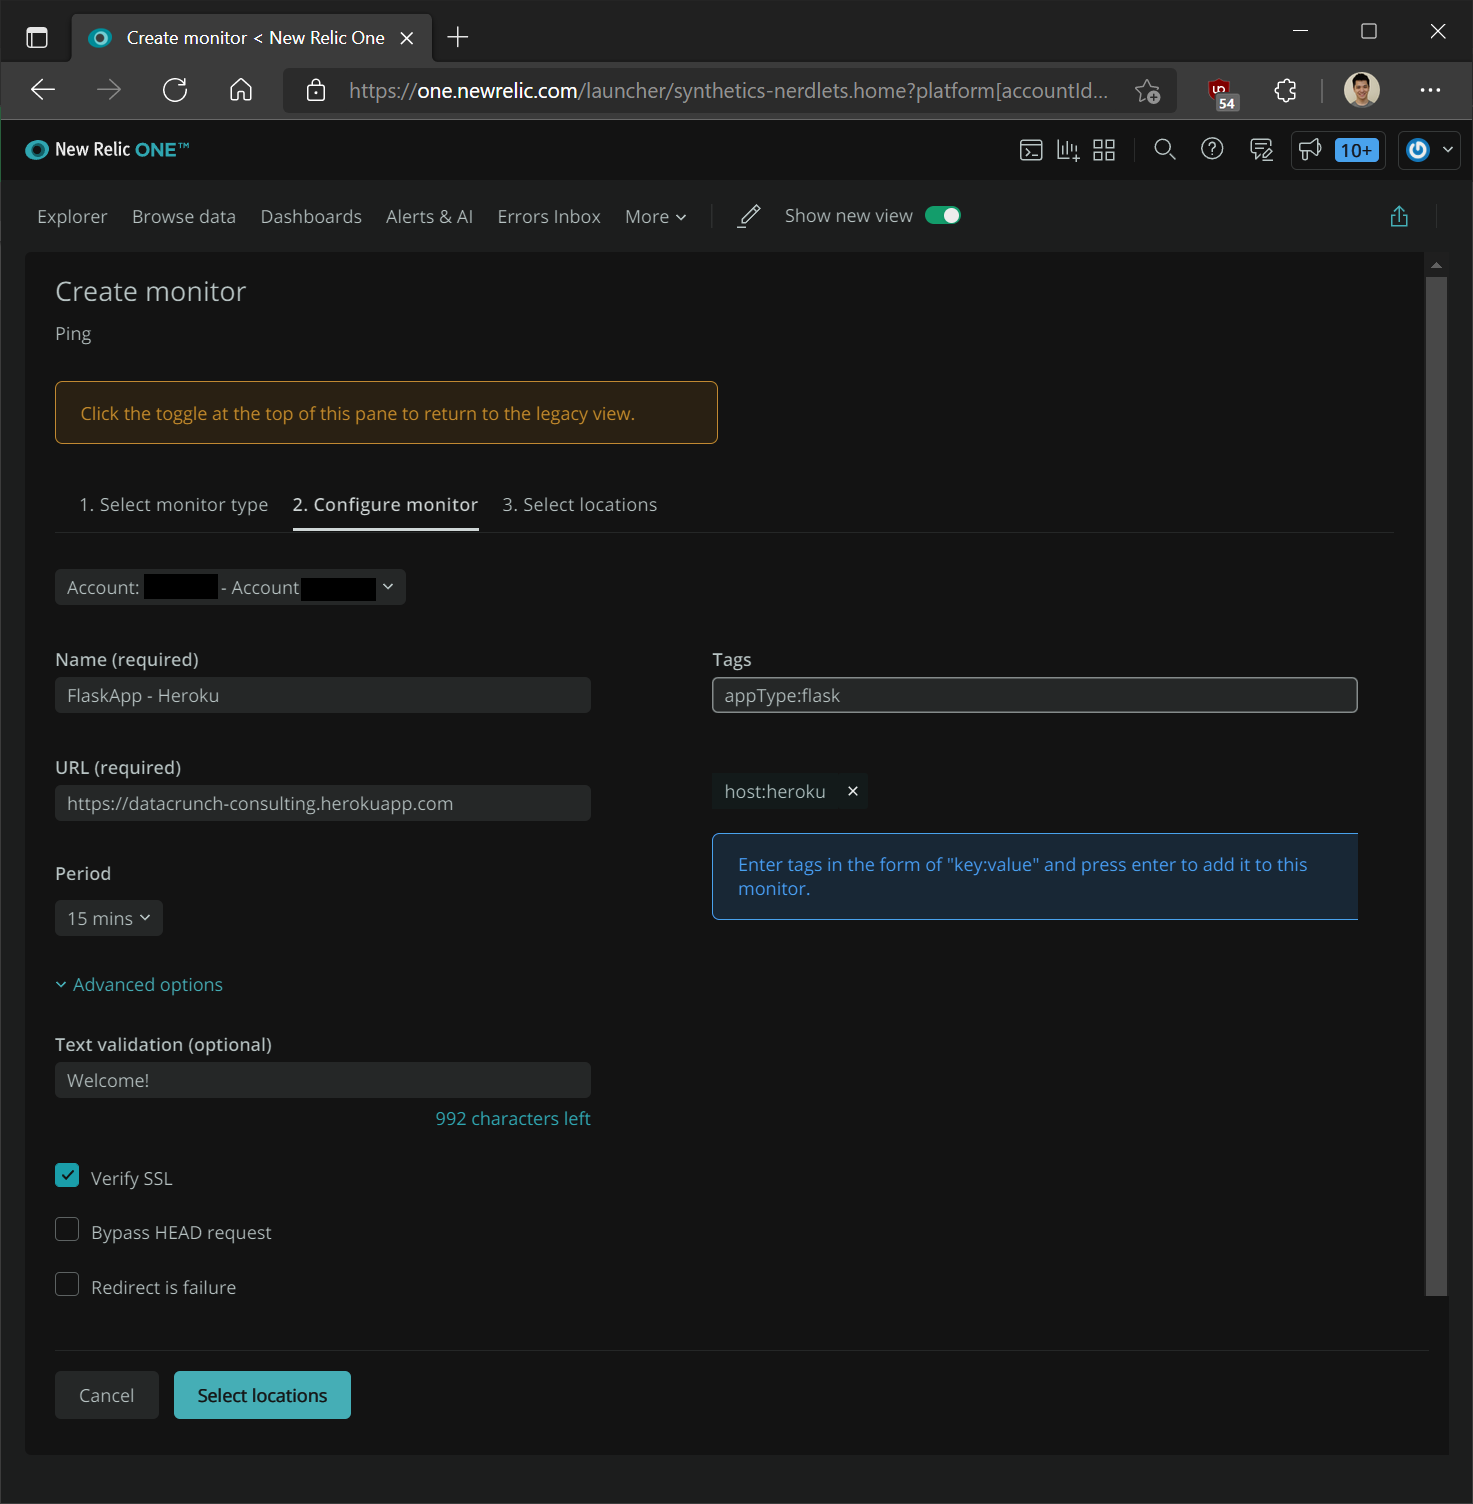
- Wait for your Synthetics ping check to get back some data to see uptime info
New Relic Logs Setup (Command Line)
General Instructions here
-
Download and install the Heorku CLI:
https://devcenter.heroku.com/articles/heroku-cli -
Check if Heroku is installed:
heroku --version -
Update Heroku CLI as needed:
heroku update -
Log in:
heroku login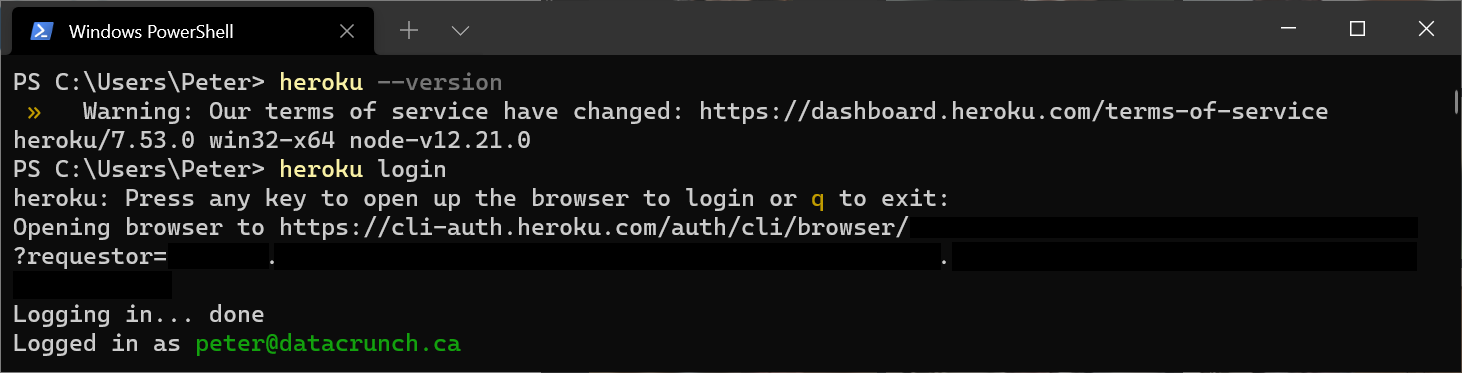
-
Check Environment variables, in case you can’t get to Heroku Dashboard > Settings:
PowerShell:heroku run env --app datacrunch-consulting | findstr -i NEW_RELIC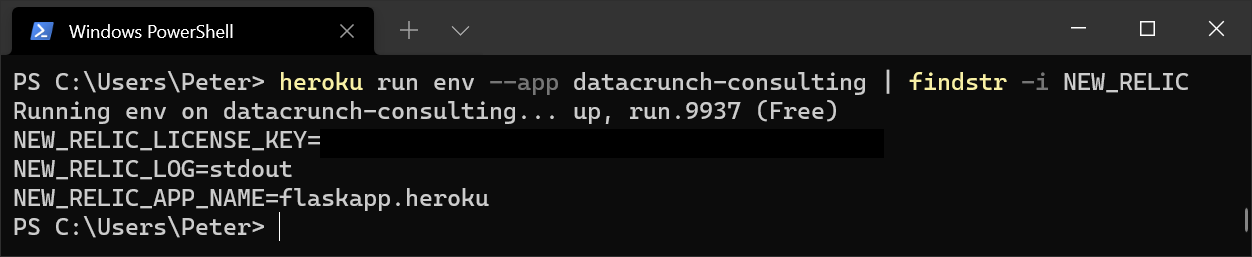
- If you need to set environment variables from the command line:
heroku config:set NEW_RELIC_LOG='stdout' --app datacrunch-consulting heroku config:set NEW_RELIC_APP_NAME='flaskapp.heroku' --app datacrunch-consulting heroku config:set NEW_RELIC_LICENSE_KEY='a1b2c3d4e5f6g7h8i9j0NRAL' --app datacrunch-consulting -
Add Drain Logs
heroku drains:add syslog+tls://newrelic.syslog.nr-data.net:6515 --app datacrunch-consulting -
Copy drain token:
heroku drains --app datacrunch-consulting --json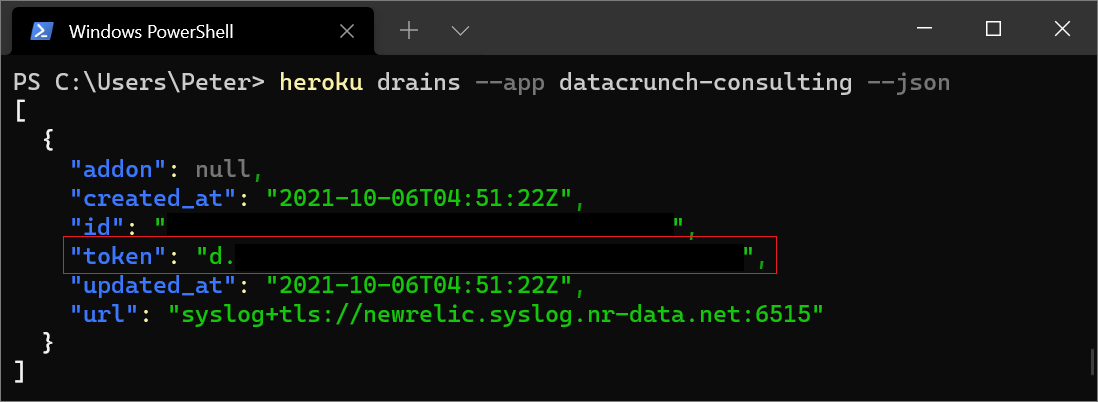
-
Add drain token in New Relic
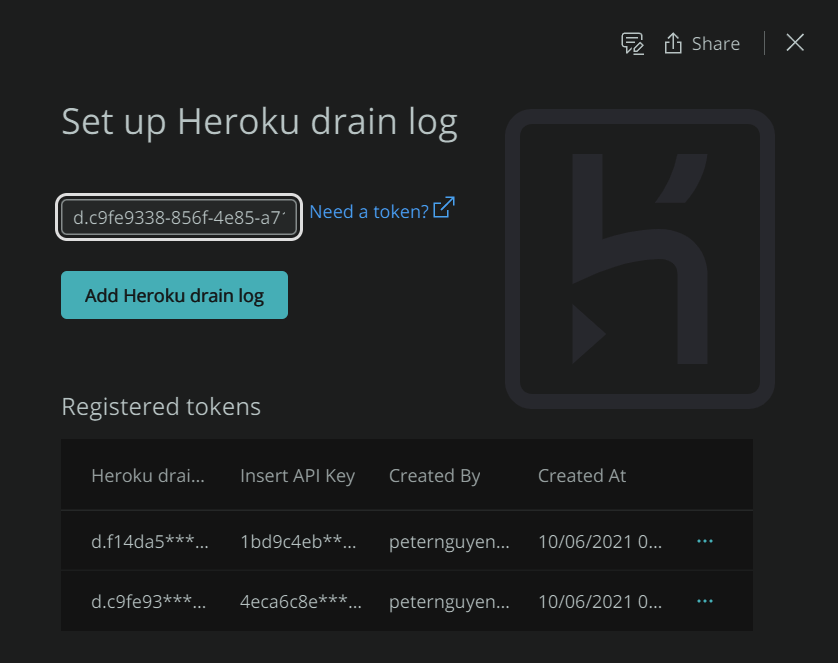
-
Add tokens and restart Heroku Dynos: Heroku Dashboard > More > Restart all Dynos or:
heroku dyno:restart --app datacrunch-consulting -
Go to New Relic One > Logs > Patterns to see logs, and any aggregated log messages based on patterns:
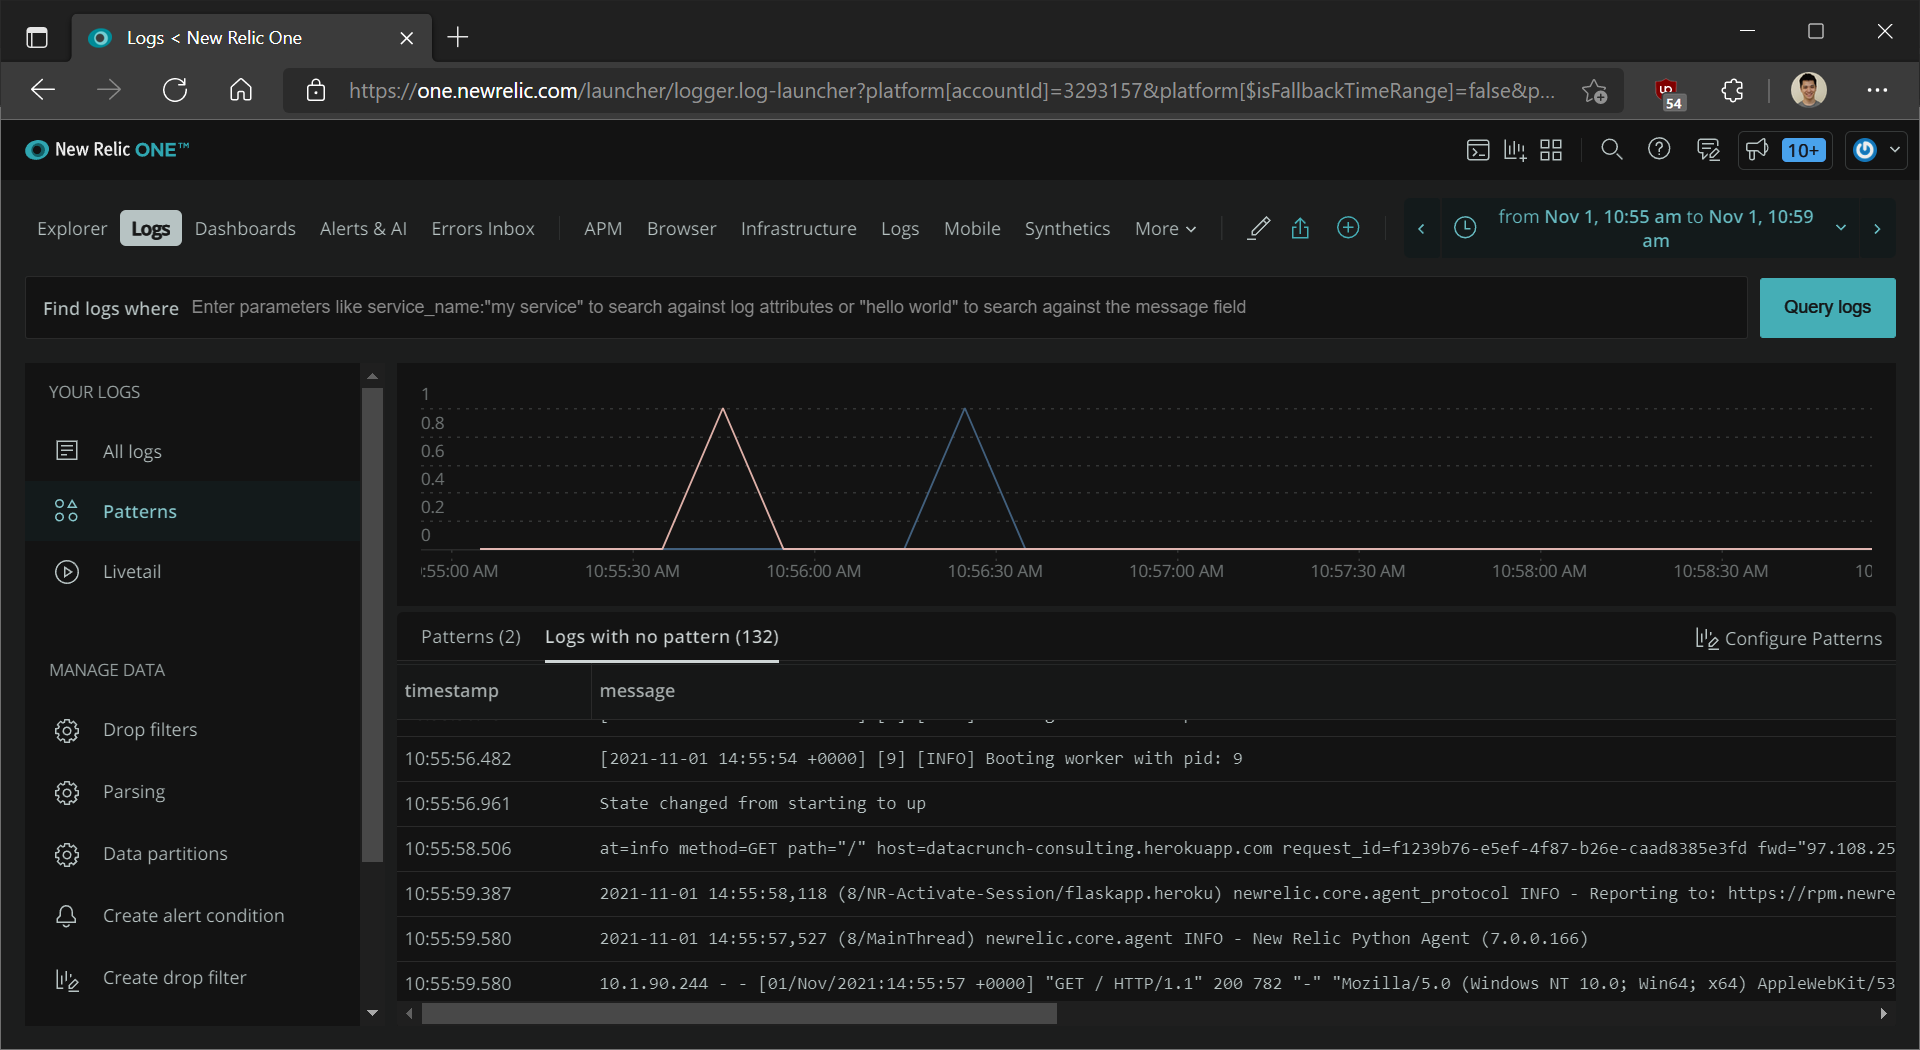
- You can also
Query your datawith NRQL to set up alerts based on log messages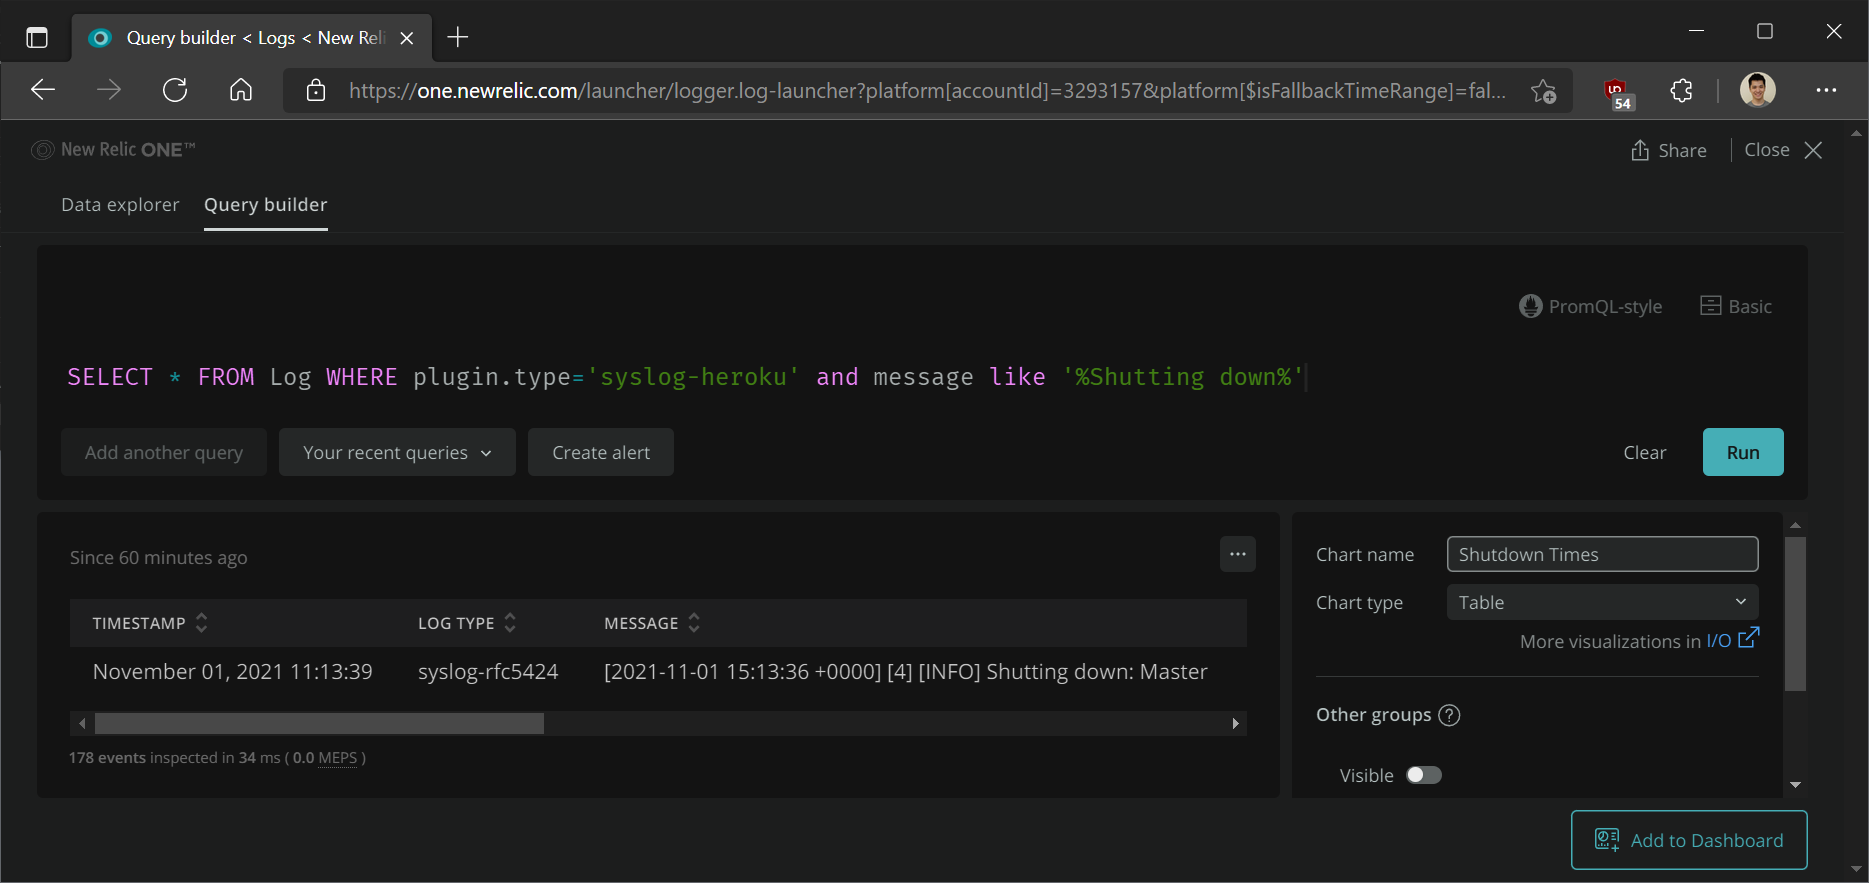
New Relic Alerts Setup
- In New Relic One, click on
Alerts & AI>Notification Channels - On the top-right, click
New notification channeland add a notification channel of your choice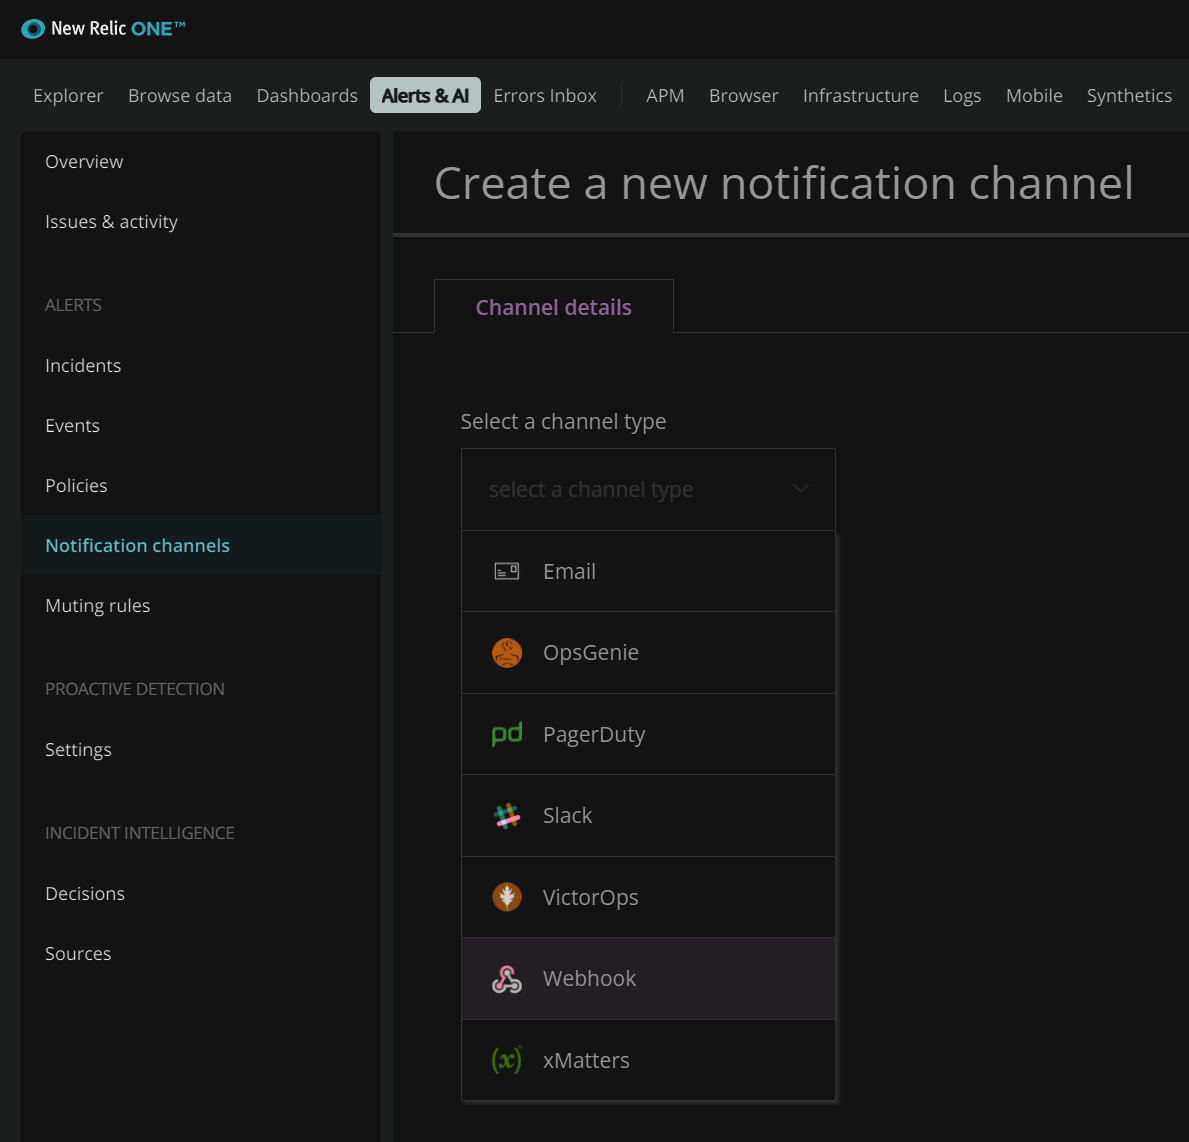
- Next, go to
Alerts & AI>Policies>New alert policy - Git your Alert Policy a Name
Create alert policy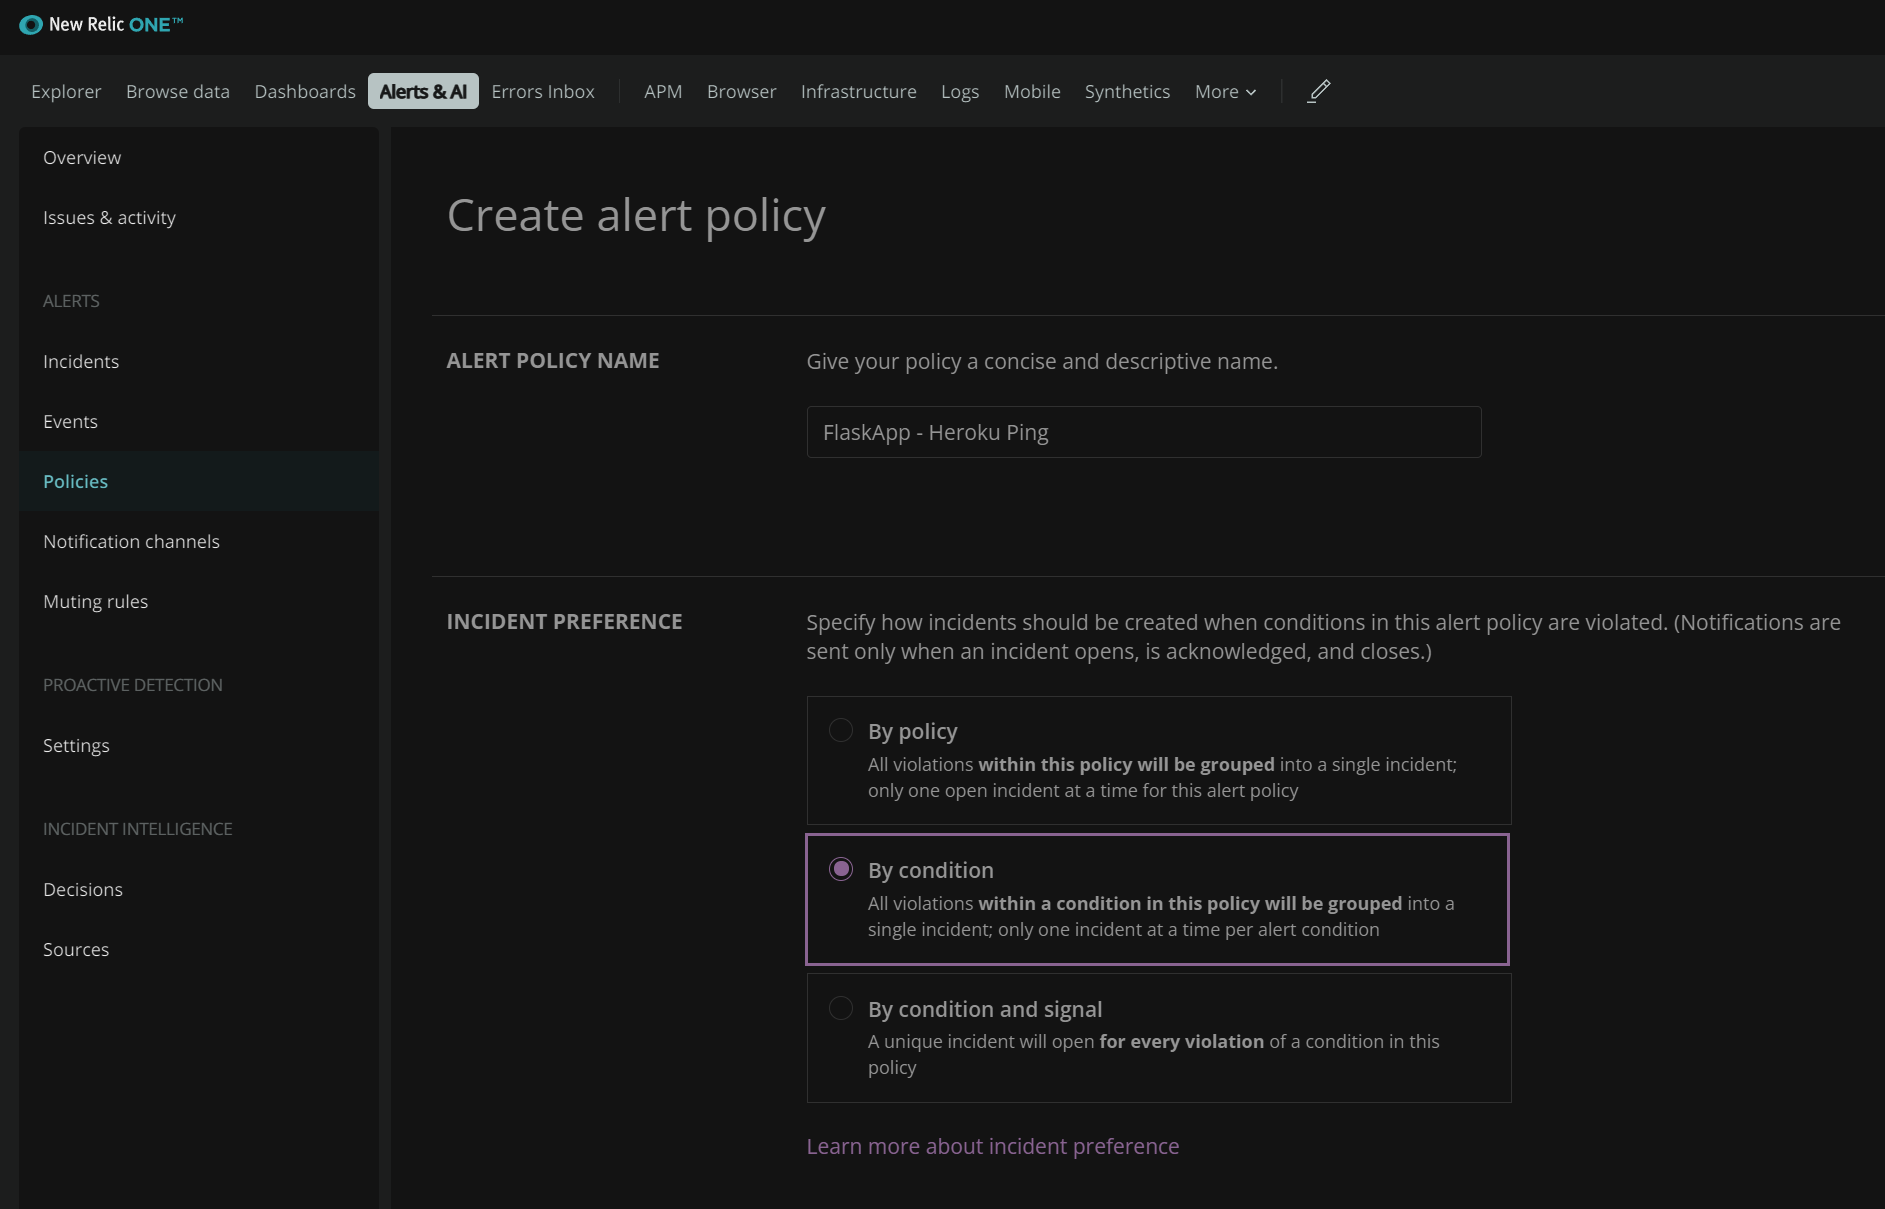
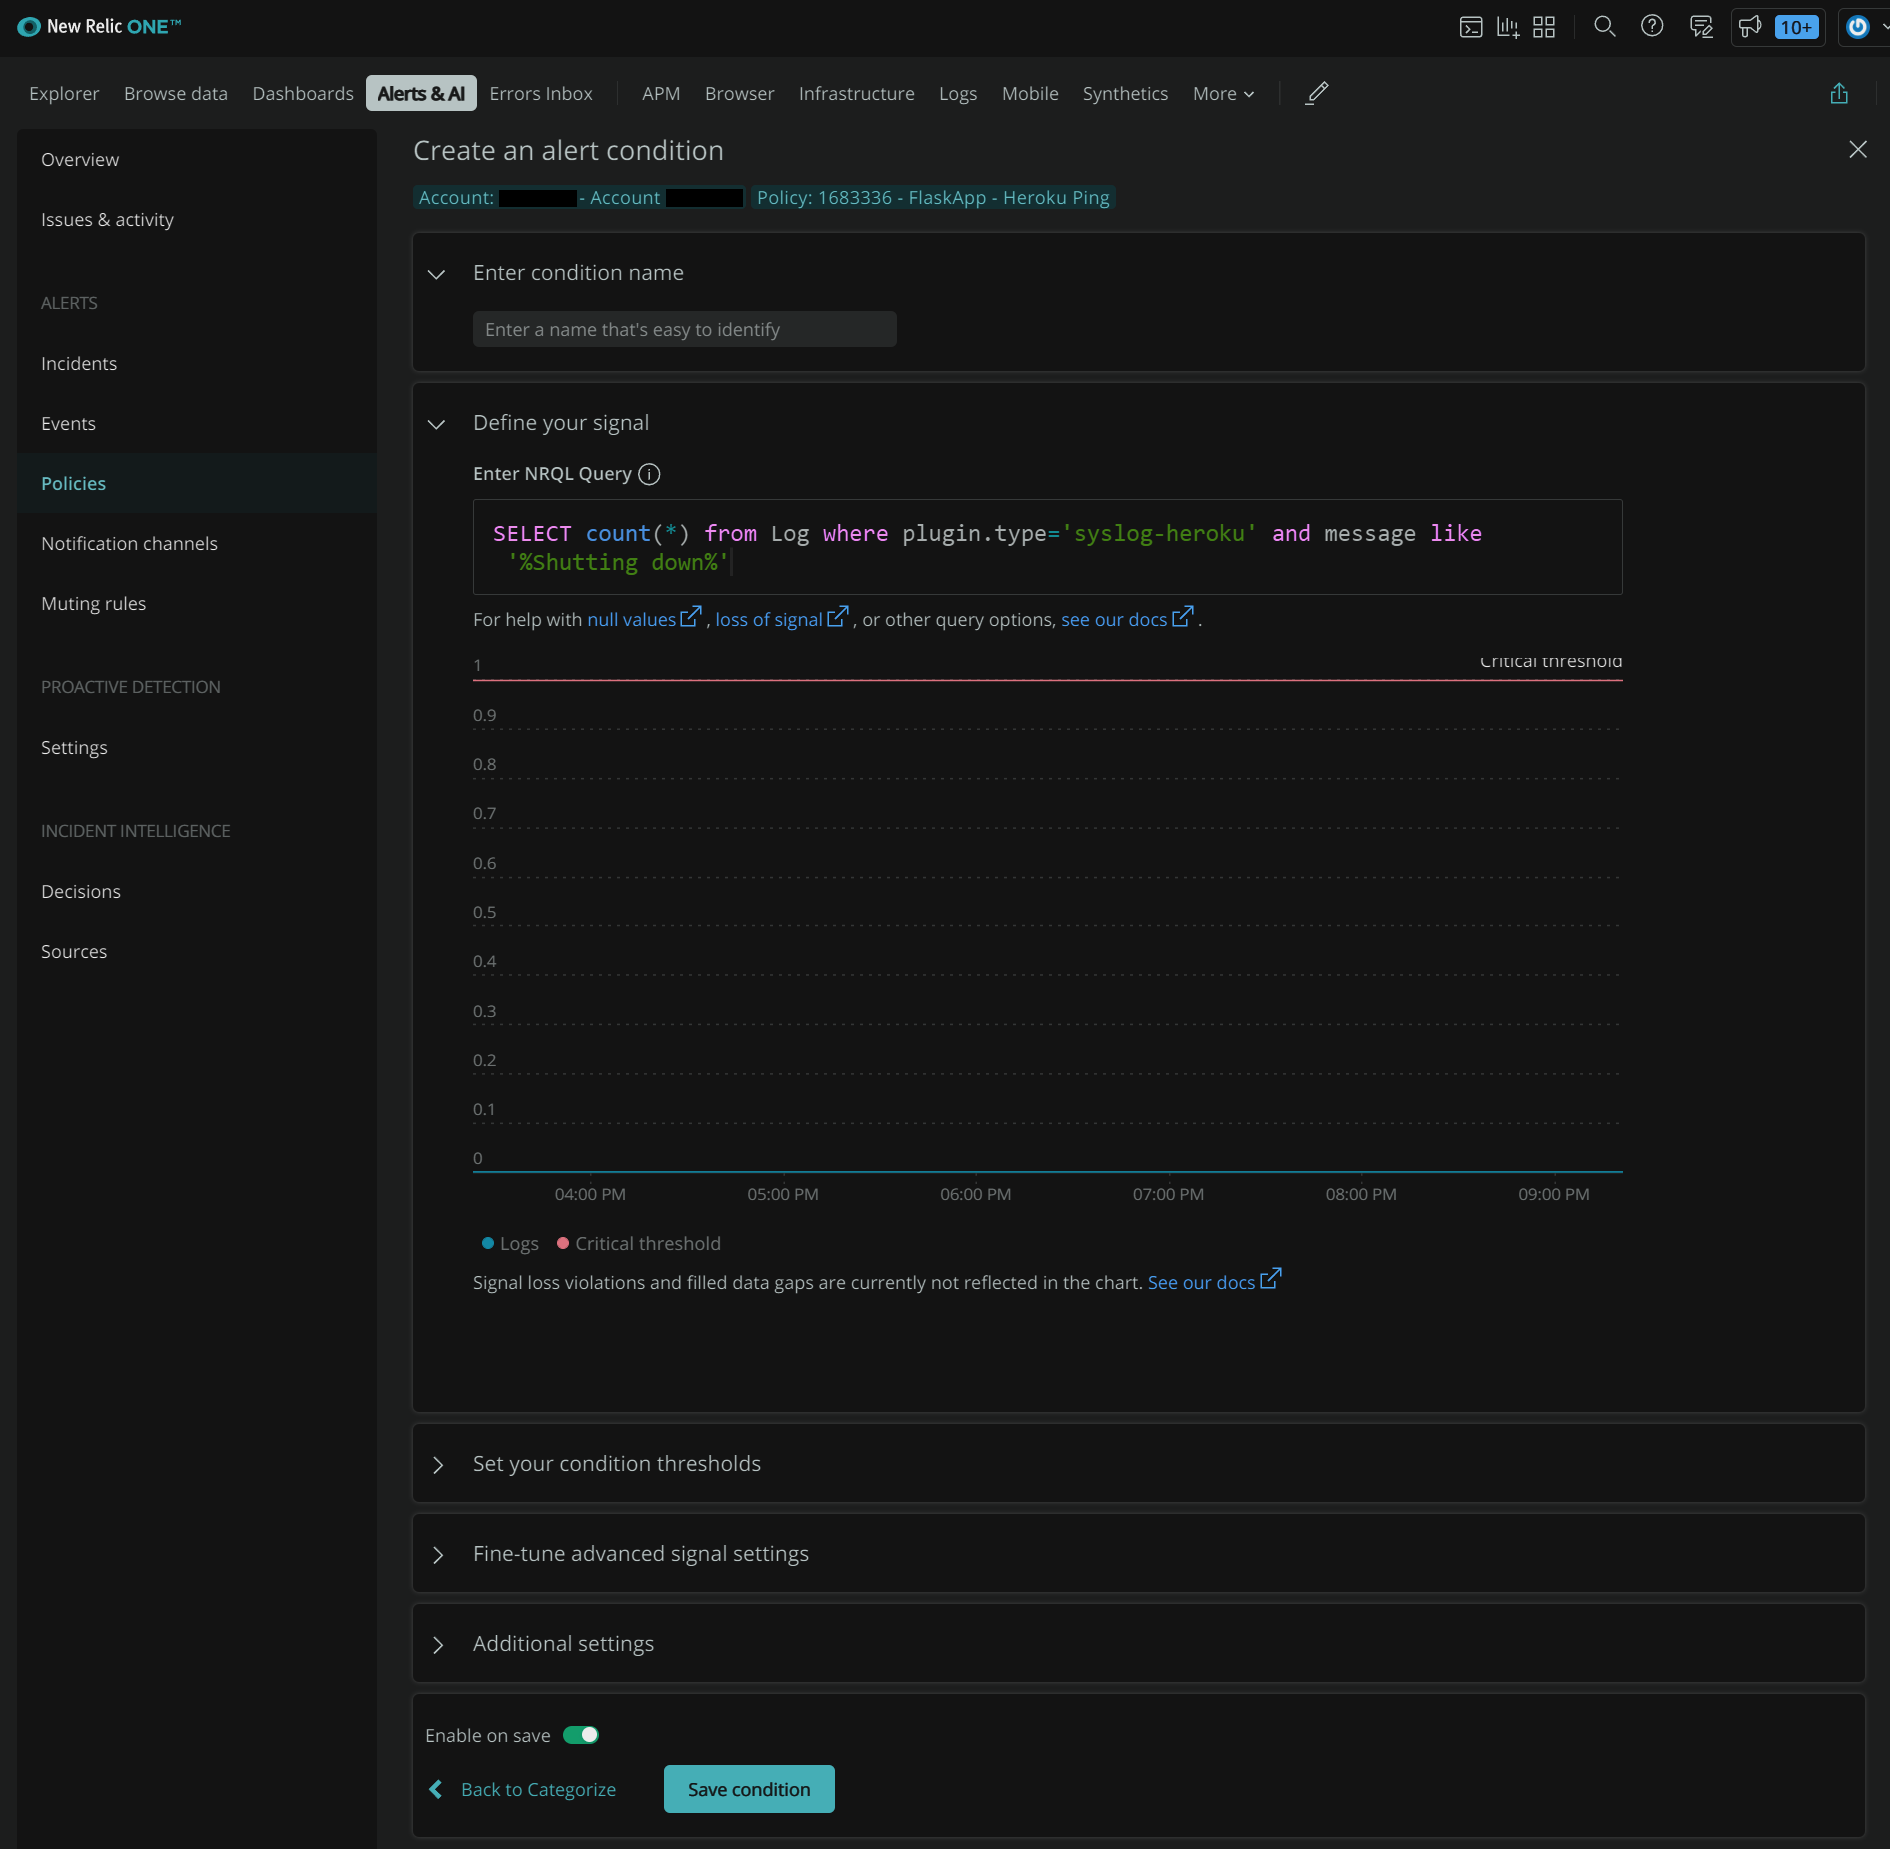
- Click on
Create a condition - Alerts for APM, Browser, and Synthetics are straight-forward and have selections to choose from. We’ll work with NRQL alerts then click
Next, define thresholds - The NRQL query we’ll use for alerting will be based on any log messages from Heroku that contain “Shutting down” at least once in 5 minutes. This will send an alert when the app shuts down on Heroku for whatever reason.
SELECT count(*) from Log where plugin.type='syslog-heroku' and message like '%Shutting down%'