Introduction
We’ll be using the OpenTelemetry Collector otelcol-contrib to gather host metrics on Windows, Linux, and Mac. At the time of this writing, we’ll be using the latest otelcol-contrib package version 0.57.2.
Windows
The following steps assumes you are running Windows PowerShell as an Administrator.
- Create a directory somewhere to keep the installation in one place.
mkdir "C:\Program Files\OpenTelemetry"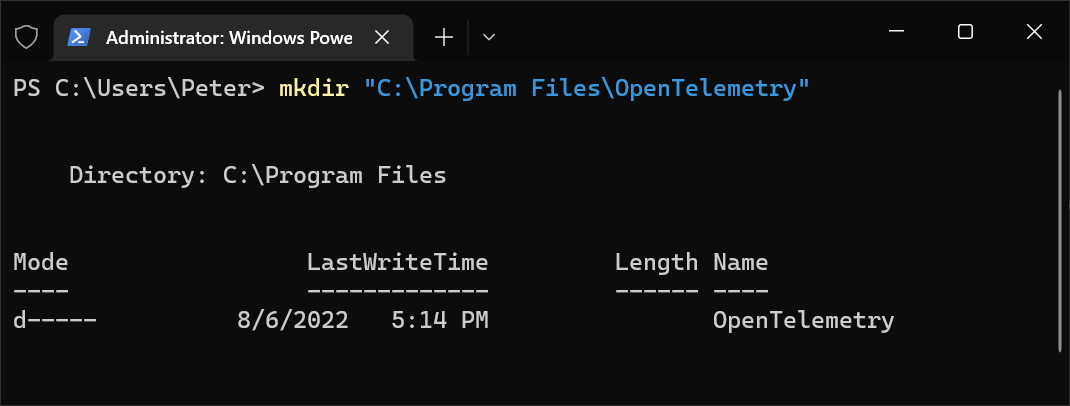
- Change to the newly created directory.
cd "C:\Program Files\OpenTelemetry"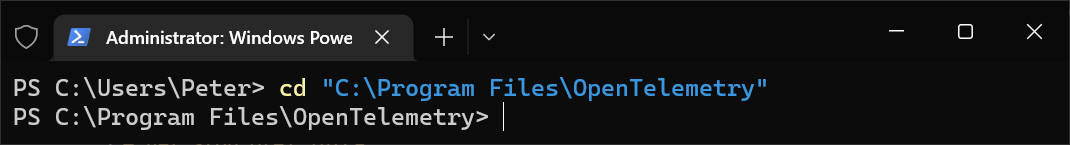
- Download the
otelcol-contribpackage from GitHub.(New-Object Net.WebClient).DownloadFile("https://github.com/open-telemetry/opentelemetry-collector-releases/releases/download/v0.57.2/otelcol-contrib_0.57.2_windows_amd64.tar.gz", "C:\Program Files\OpenTelemetry\otelcol-contrib_0.57.2_windows_amd64.tar.gz")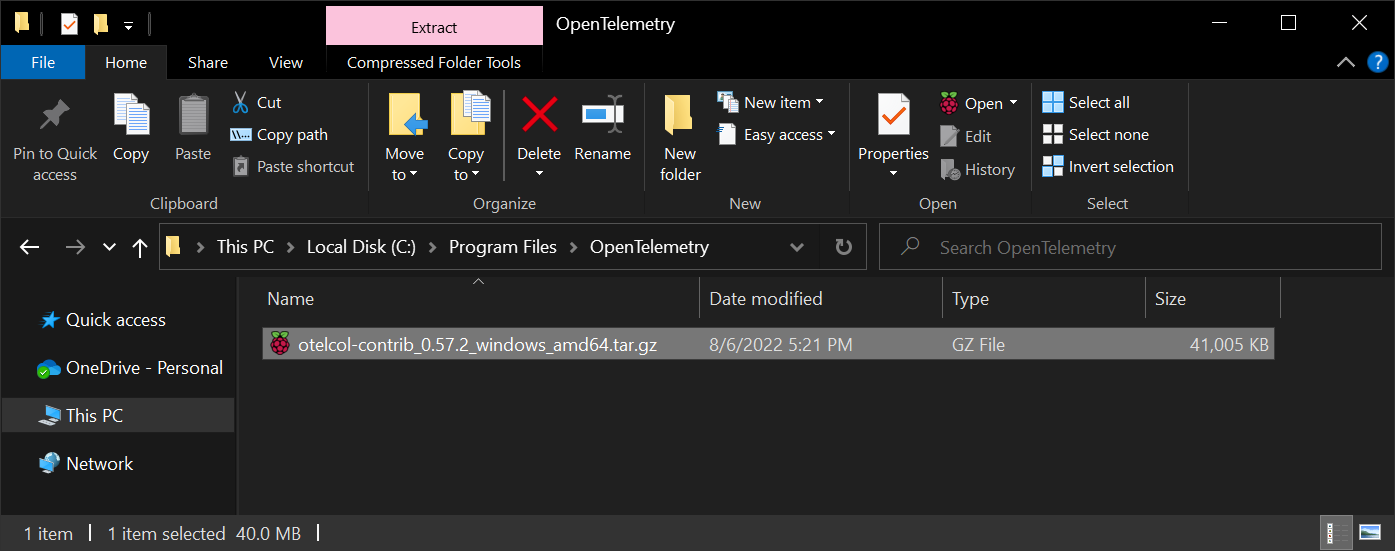
- Extract the files to the current directory, either using the command line or 7zip should work.
tar -xf otelcol-contrib_0.57.2_windows_amd64.tar.gz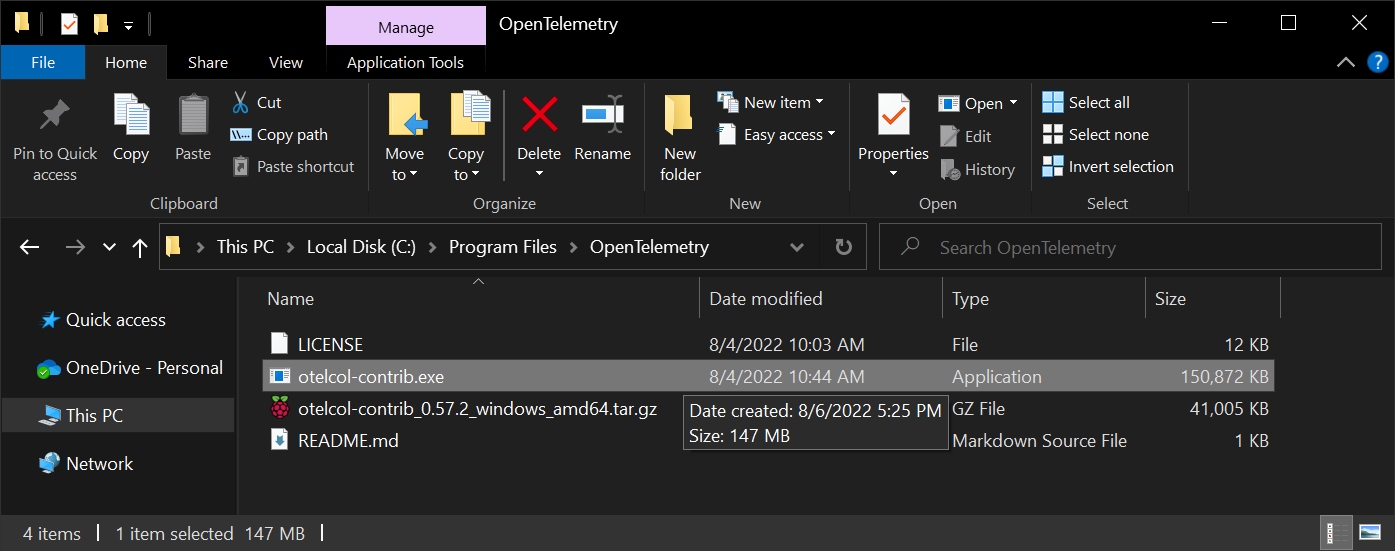
- Download a sample configuration file for the OpenTelemetry Contrib collector from GitHub
(New-Object Net.WebClient).DownloadFile("https://gist.githubusercontent.com/pnvnd/1533b04609fbbe583056afdc31683667/raw/242f9fa682989639a06fc22eb209b8ffd1a4d4c3/otel-config_windows.yaml", "C:\Program Files\OpenTelemetry\otel-config_windows.yaml")Otherwise, you can create
otel-config_windows.yamlmanually with the following:extensions: health_check: receivers: hostmetrics: collection_interval: 20s scrapers: cpu: metrics: system.cpu.utilization: enabled: true load: memory: metrics: system.memory.utilization: enabled: true disk: filesystem: metrics: system.filesystem.utilization: enabled: true network: paging: metrics: system.paging.utilization: enabled: true # processes: process: mute_process_name_error: true processors: memory_limiter: check_interval: 1s limit_mib: 1000 spike_limit_mib: 200 batch: cumulativetodelta: include: metrics: - system.network.io - system.disk.operations - system.network.dropped - system.network.packets - process.cpu.time match_type: strict resource: attributes: - key: host.id from_attribute: host.name action: upsert resourcedetection: detectors: [env, system] exporters: otlp: endpoint: https://otlp.nr-data.net:4317 headers: api-key: YOUR_KEY_HERE service: pipelines: metrics: receivers: [hostmetrics] processors: [batch, resourcedetection, resource, cumulativetodelta] exporters: [otlp]Note: The
processesis commented out for the Windows configuration, since this is only supported in Linux. - Edit the
otel-config_windows.yamlfile and replaceYOUR_KEY_HEREwith your New Relic Ingest - License key ending with NRAL((Get-Content -path "C:\Program Files\OpenTelemetry\otel-config_windows.yaml" -Raw) -replace 'YOUR_KEY_HERE','XXXXXXXXXXXXXXXXXXXXXXXXXXXXXXXXXXXXNRAL') | Set-Content -Path "C:\Program Files\OpenTelemetry\otel-config_windows.yaml"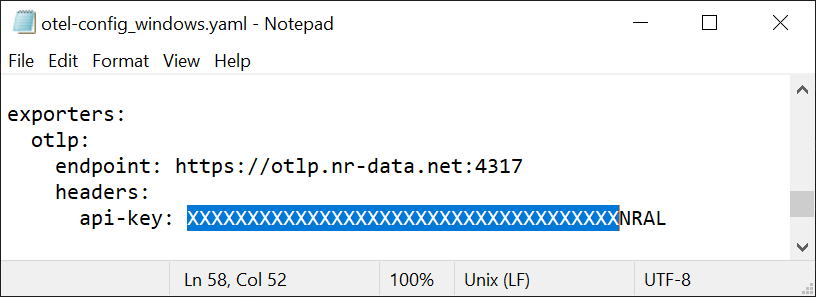
- Create a Windows service to run the OpenTelemetry Collector in the background
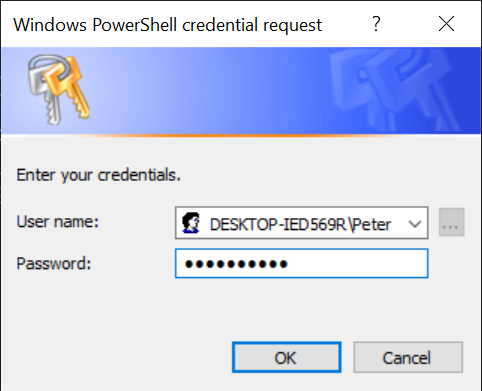
New-Service -Name "otel-infra" -BinaryPathName 'C:\Program Files\OpenTelemetry\otelcol-contrib.exe --config=file:"C:\Program Files\OpenTelemetry\otel-config_windows.yaml"' -DisplayName "OpenTelemetry Infrastructure Agent" -StartupType Manual -Description "OpenTelemetry Infrastructure Agent v0.57.2" -Credential "DESKTOP-IED569R\Peter"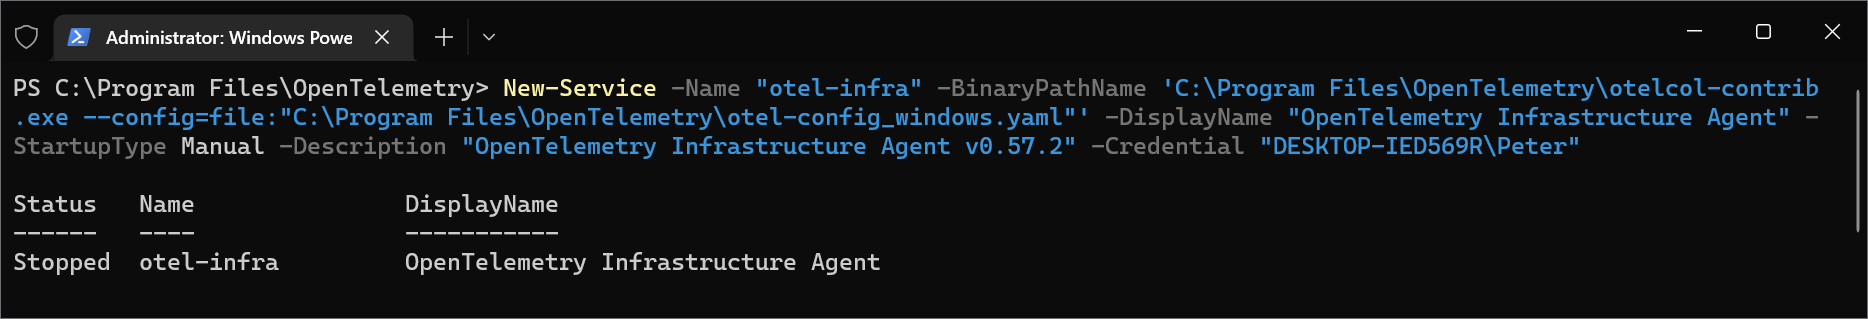
Note: Running this service as a
Local Systemaccount does not have access to gather storage metrics, so you’ll need to create a service account or use your current account credentials to get these metrics.
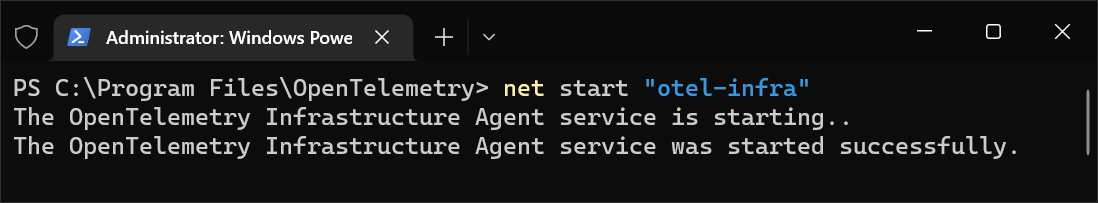
- Start the
otel-infraservice by runningservices.mscor use the command linenet start "otel-infra"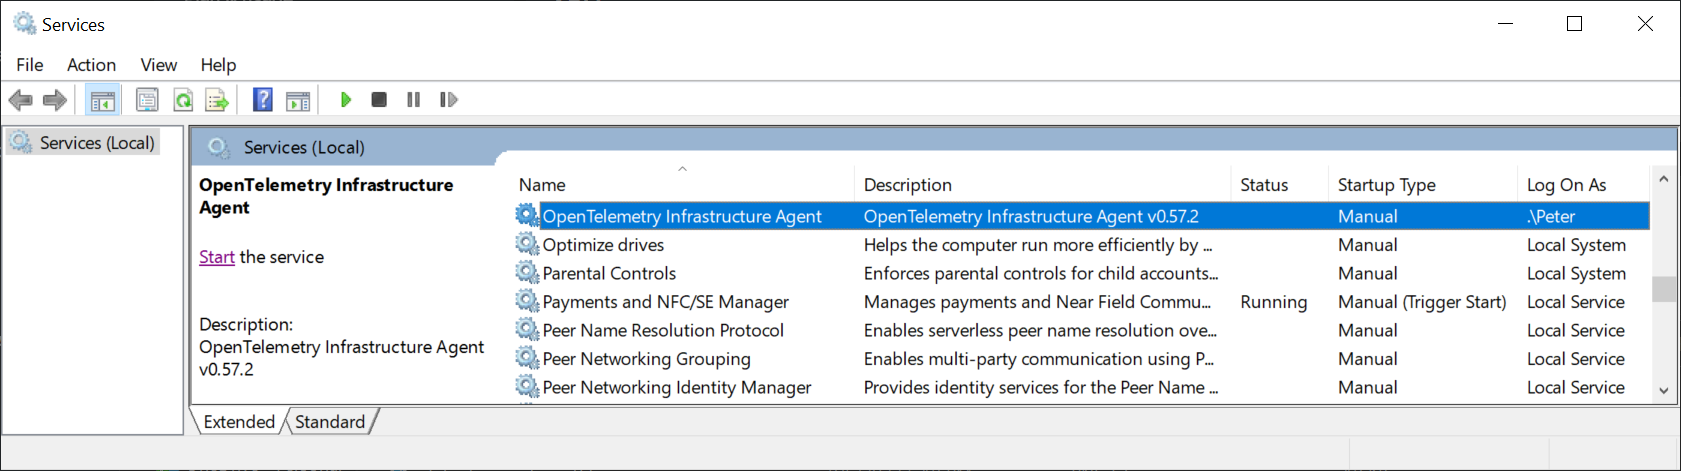
-
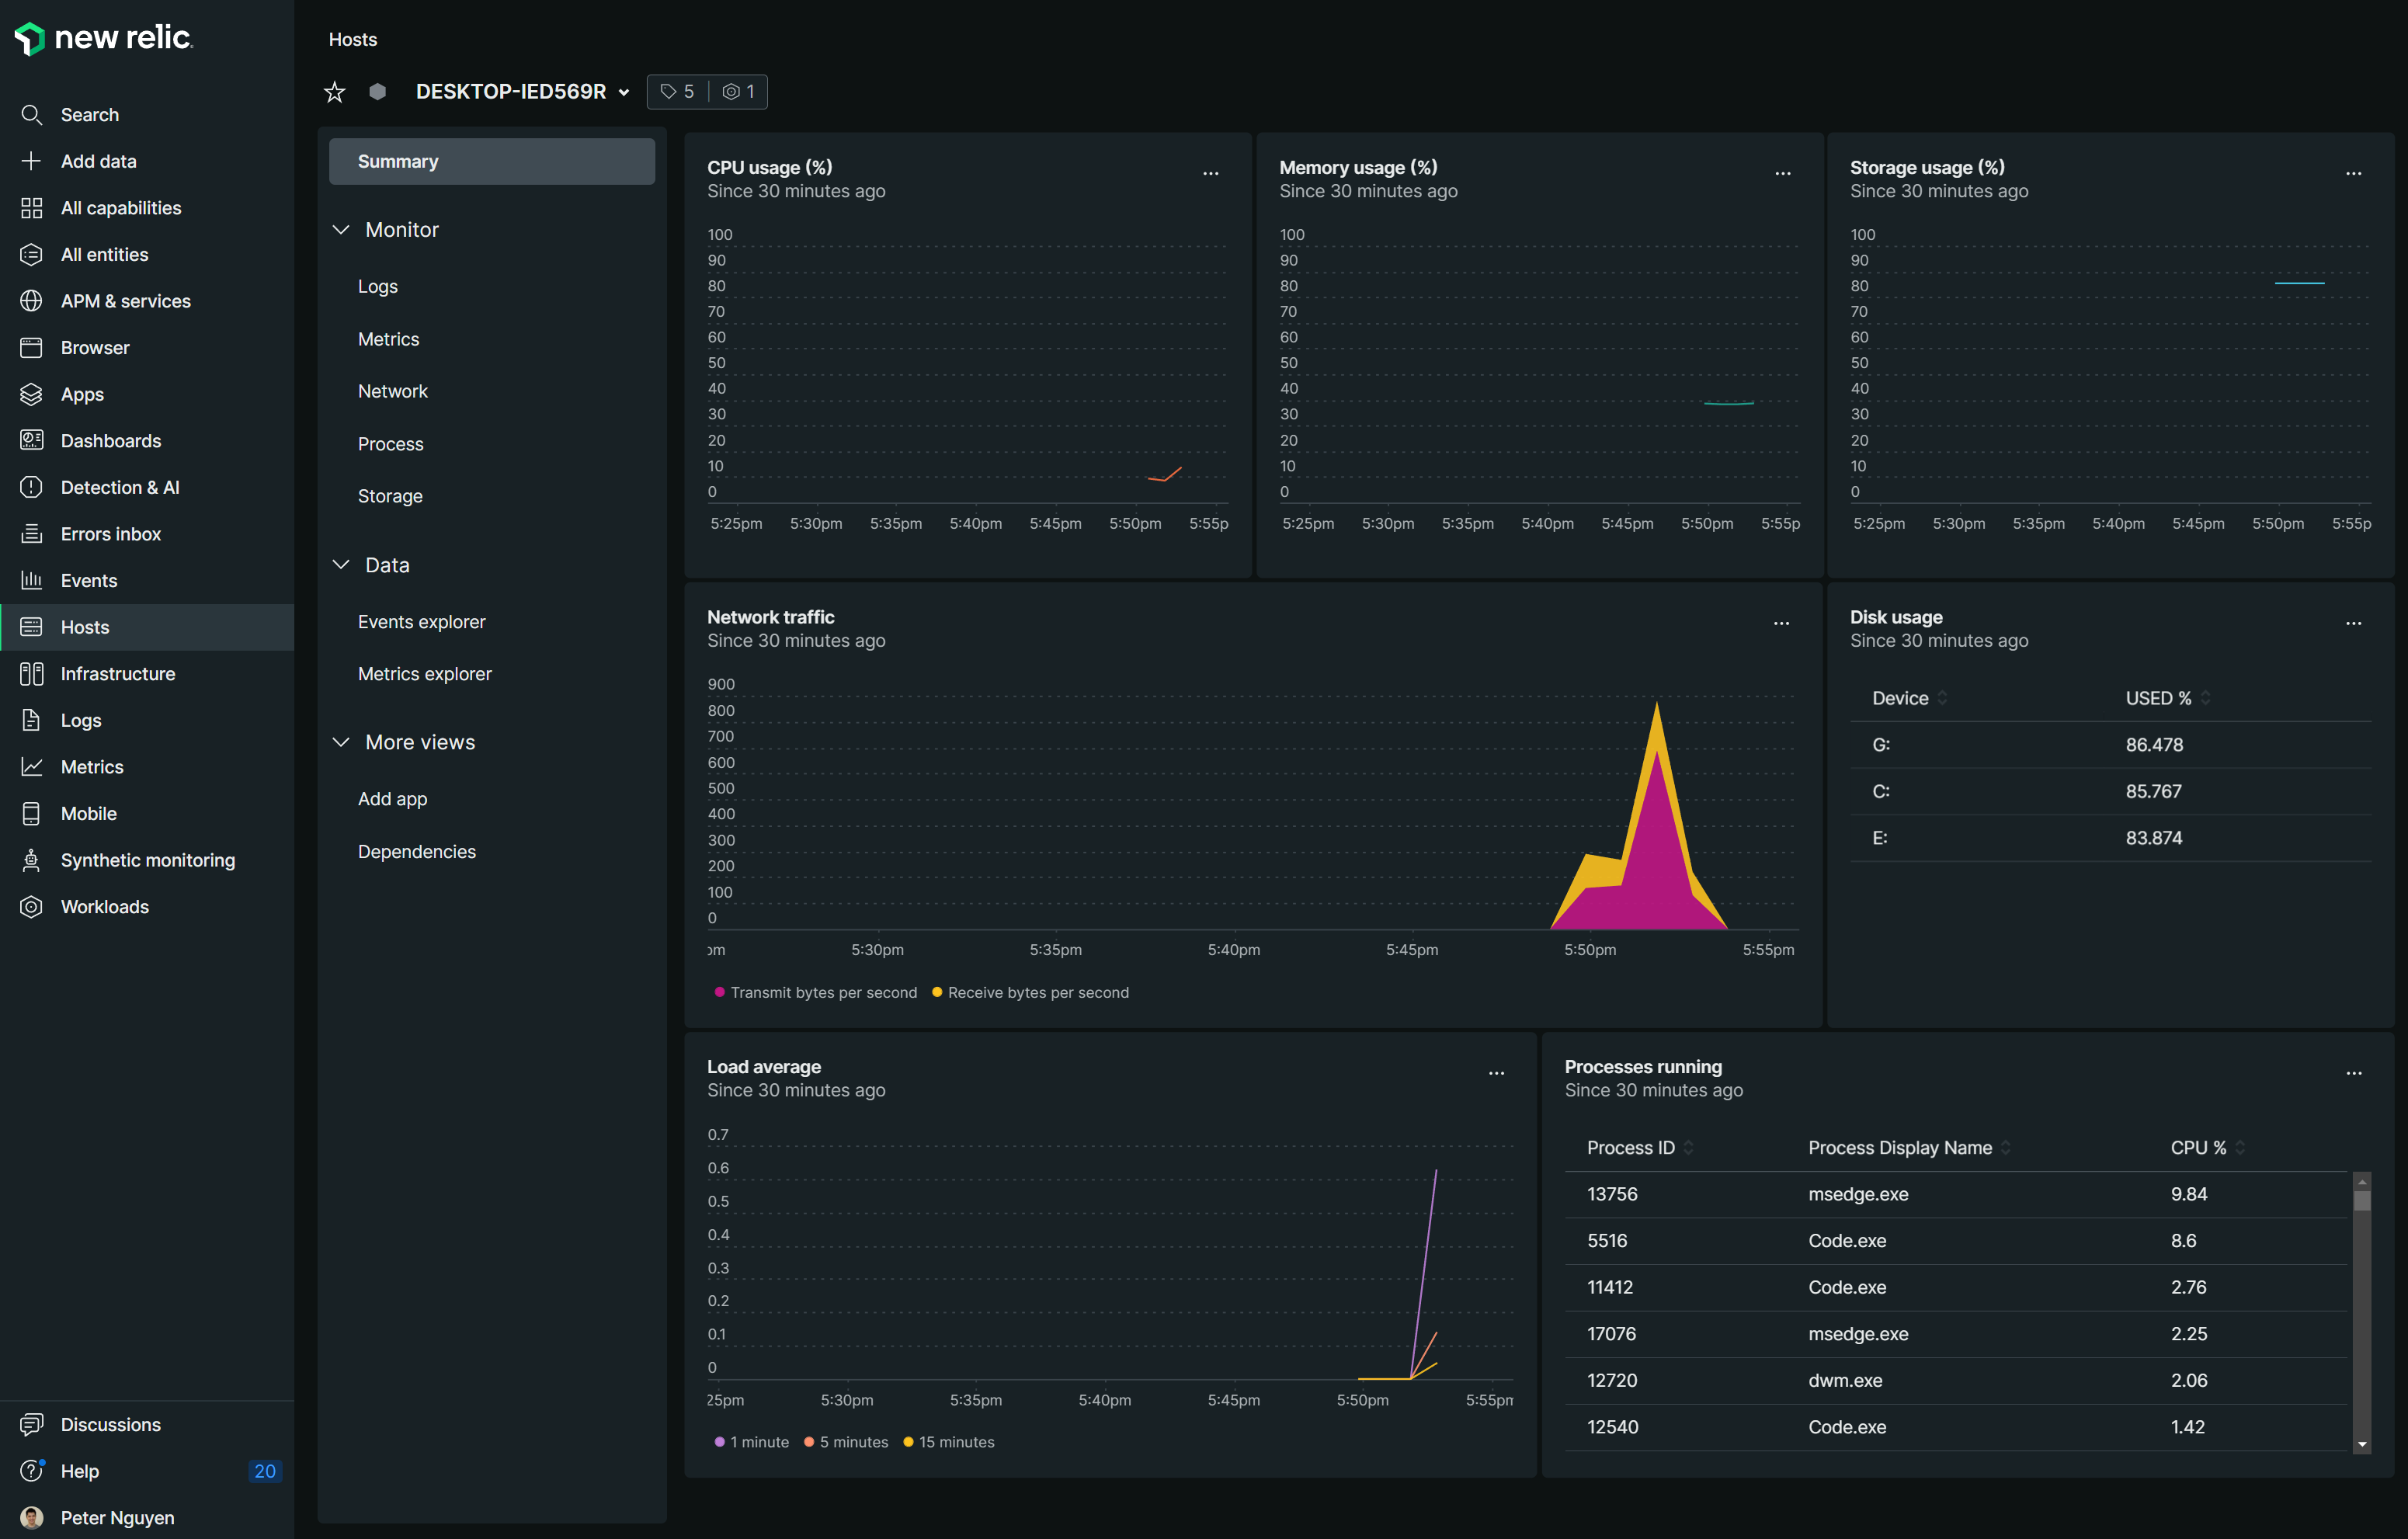
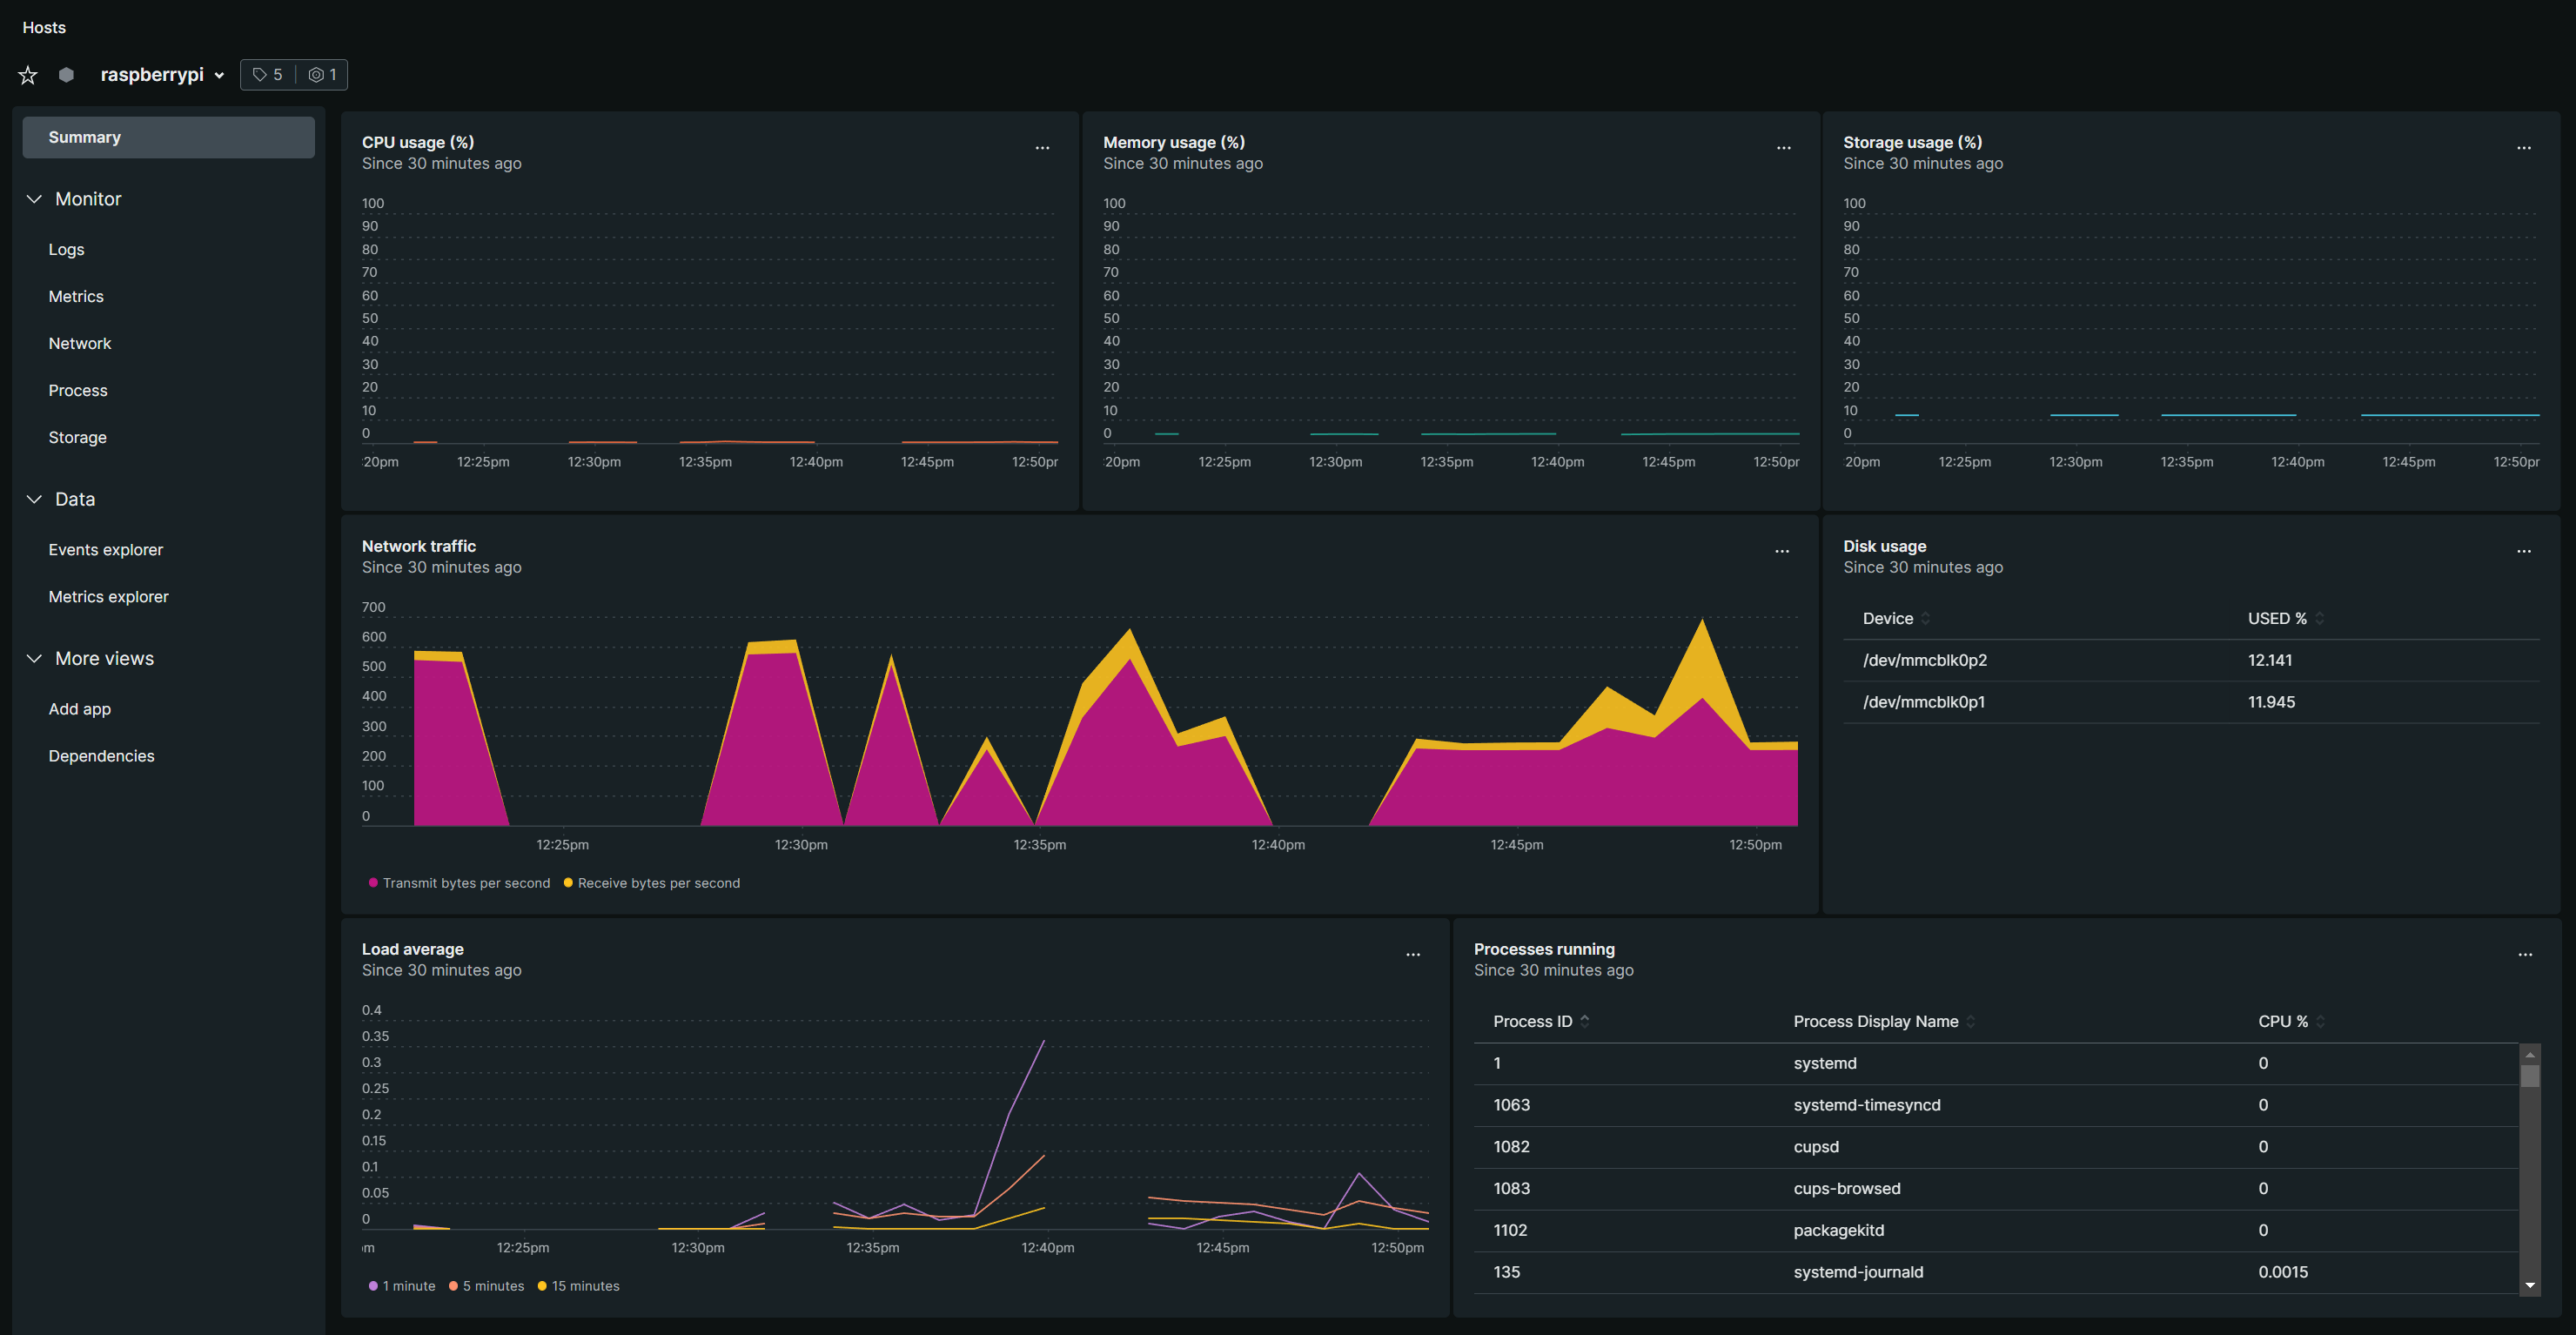
Log into New Relic and check your Hosts to see metrics.
- Stop the
otel-infraservice withnet stop "otel-infra" - If you need to uninstall the service and remove the files, use this command
"sc delete otel-infra" | cmd
cd ~
rm -r "C:\Program Files\OpenTelemetry"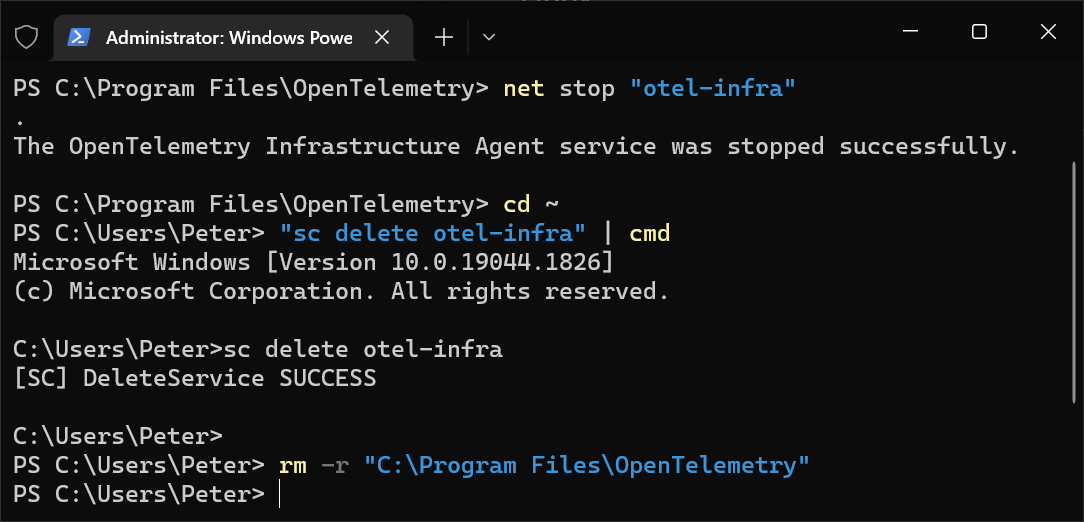
Linux
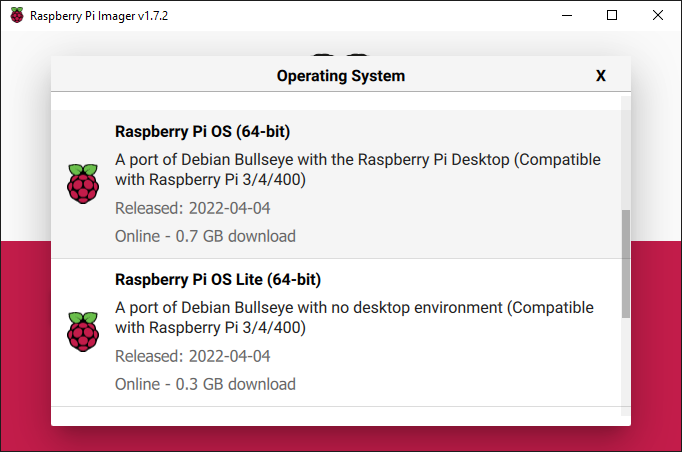
Similar to the Windows setup, commands will be listed here to do the same thing, but with a Raspberry Pi 4B device.
- Make a directory somewhere to save the files and configurations
sudo mkdir /opt/opentelemetry - Change to the newly created directory
cd /opt/opentelemetry - Download the
otelcol-contribpackage for Linux. In this example, we’re running this on a Raspberry Pi 4B (8GB) with Raspbian (64-Bit), so we’re going to get thearm64version.sudo wget https://github.com/open-telemetry/opentelemetry-collector-releases/releases/download/v0.57.2/otelcol-contrib_0.57.2_linux_arm64.tar.gz - Download a sample configuration file for Linux
sudo wget https://gist.githubusercontent.com/pnvnd/1533b04609fbbe583056afdc31683667/raw/93c55d4065bc783d3f340931cca91fceacccaae8/otel-config_linux.yamlOtherwise, create
otel-config_linux.yamlmanually with the followingextensions: health_check: receivers: hostmetrics: collection_interval: 20s scrapers: cpu: metrics: system.cpu.utilization: enabled: true load: memory: metrics: system.memory.utilization: enabled: true disk: filesystem: metrics: system.filesystem.utilization: enabled: true network: paging: metrics: system.paging.utilization: enabled: true processes: process: mute_process_name_error: true processors: memory_limiter: check_interval: 1s limit_mib: 1000 spike_limit_mib: 200 batch: cumulativetodelta: include: metrics: - system.network.io - system.disk.operations - system.network.dropped - system.network.packets - process.cpu.time match_type: strict resource: attributes: - key: host.id from_attribute: host.name action: upsert resourcedetection: detectors: [env, system] exporters: otlp: endpoint: https://otlp.nr-data.net:4317 headers: api-key: YOUR_KEY_HERE service: pipelines: metrics: receivers: [hostmetrics] processors: [batch, resourcedetection, resource, cumulativetodelta] exporters: [otlp] - Extract the files
sudo tar -xf otelcol-contrib_0.57.2_linux_arm64.tar.gz - Check the version of your
otelcol-contribpackagesudo ./otelcol-contrib --version - Edit
otel-config_linux.yamland update with your New Relic Ingest - License keysudo nano otel-config_linux.yamlOtherwise run this command
sudo sed -i 's/YOUR_KEY_HERE/XXXXXXXXXXXXXXXXXXXXXXXXXXXXXXXXXXXXNRAL/' otel-config_linux.yaml - Start your OpenTelemetry Collector in background
sudo nohup ./otelcol-contrib --config=file:"/home/pi/otel/otel-config_linux.yaml" & -
Log into New Relic and check your hosts for metrics
- To check if you are running the
otelcol-contribrunsuo ps aux | grep otelcol-contrib - Stop the
otelcol-contribservice from running using this commandsudo pkill otelcol-contrib
Mac
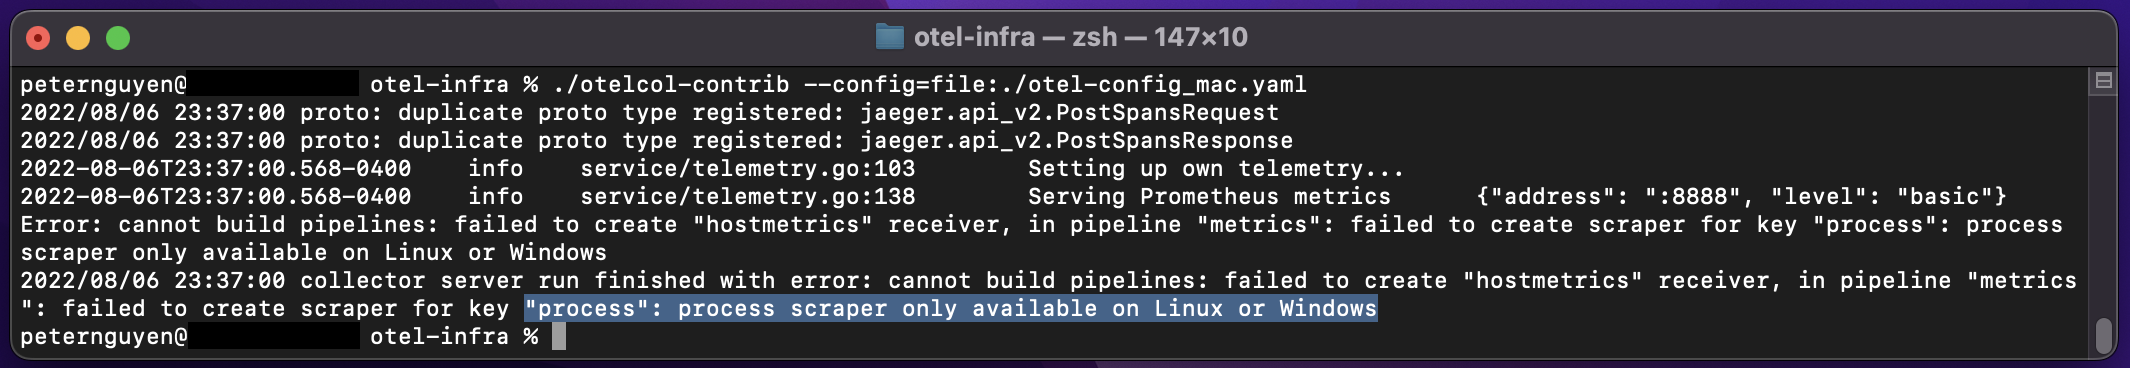
More support is being added to Mac devices, so at the time of this writing, cpu and some disk/storage metrics are not captured by the otelcol-contrib package.
-
Download the darwin
otelcol-contribpackage for your MacOS - amd64 for Intel Macs or arm64 newer Macs. IN this example, I’ll be usinghttps://github.com/open-telemetry/opentelemetry-collector-releases/releases/download/v0.57.2/otelcol-contrib_0.57.2_darwin_amd64.tar.gz -
Once downloaded, double-click on the
tar.gzpackage to extract the files.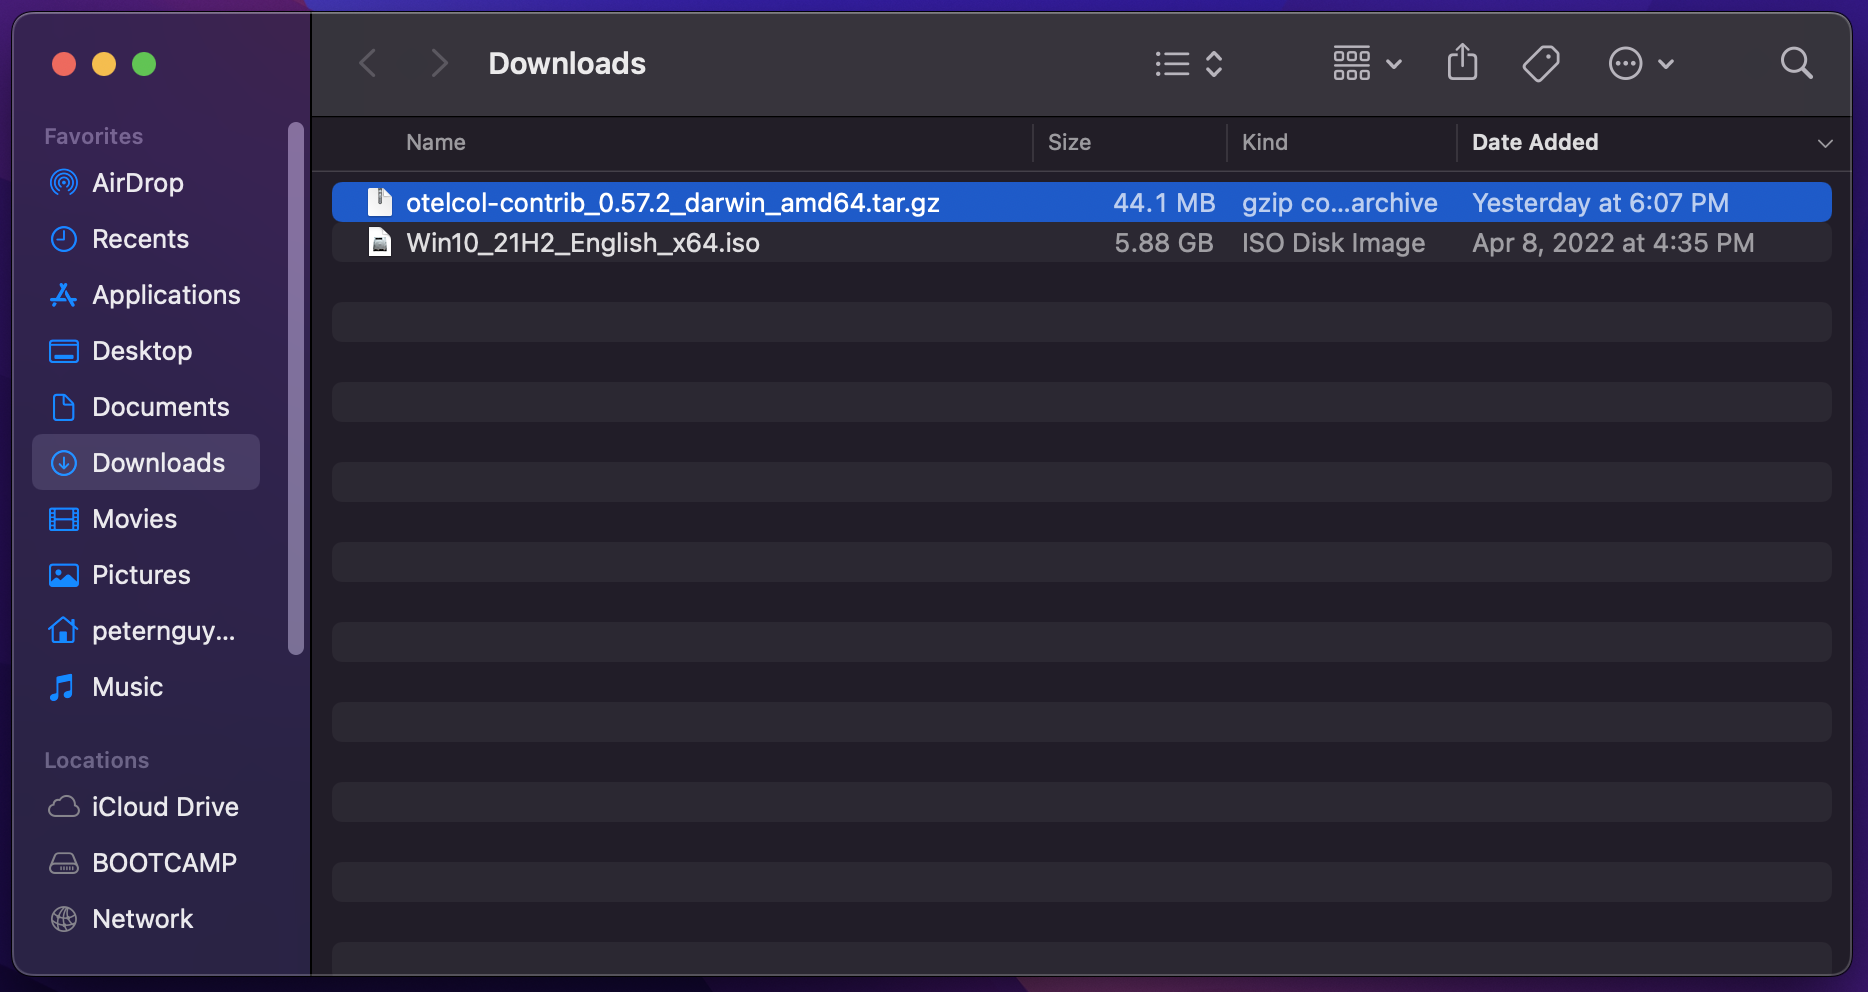
-
Create a folder somewhere,
/Users/yourname/Desktop/otel-infrashould be fine.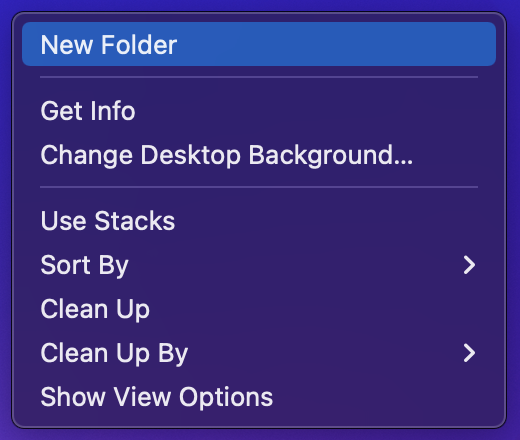
-
Copy or move the
otelcol-contribpackage to theotel-infrafolder. Then, right-click > Open.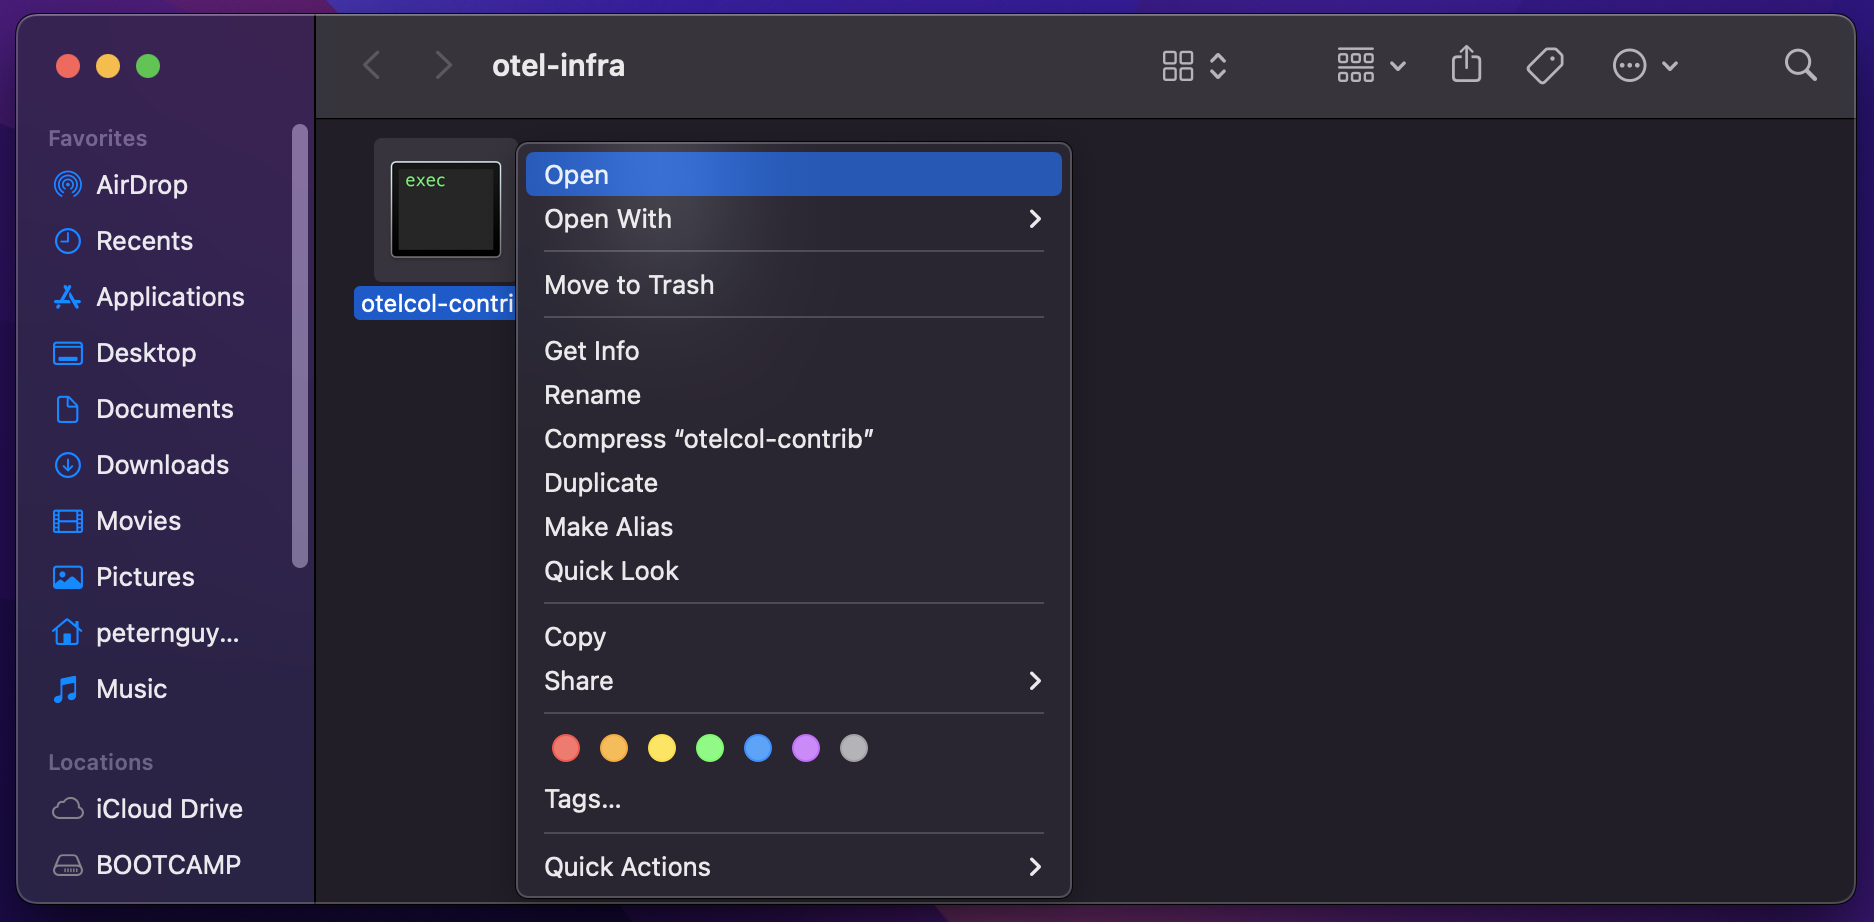
-
Click
Open. While nothing should happen, we do this to allow your Mac permissions to run the OpenTelemetry Collector in a terminal.
- Download a configuration file for
otelcol-contribhere:https://gist.githubusercontent.com/pnvnd/1533b04609fbbe583056afdc31683667/raw/d34ca012a2035b5d6636fa6867247f5418cc3322/otel-config_mac.yamlOtherwise, create the file manually with the following:
 extensions:
   health_check:

 receivers:
   hostmetrics:
     collection_interval: 20s
     scrapers:
 #     cpu:
 #       metrics:
 #         system.cpu.utilization:
 #           enabled: true
       load:
       memory:
         metrics:
           system.memory.utilization:
             enabled: true
 #     disk:
       filesystem:
         metrics:
           system.filesystem.utilization:
             enabled: false
       network:
       paging:
         metrics:
           system.paging.utilization:
             enabled: true
       processes:
 #     process:

 processors:
   memory_limiter:
     check_interval: 1s
     limit_mib: 1000
     spike_limit_mib: 200
   batch:
   cumulativetodelta:
     include:
       metrics:
         - system.network.io
         - system.disk.operations
         - system.network.dropped
         - system.network.packets
         - process.cpu.time
       match_type: strict
   resource:
     attributes:
       - key: host.id
         from_attribute: host.name
         action: upsert
   resourcedetection:
     detectors: [env, system]

 exporters:
   otlp:
     endpoint: https://otlp.nr-data.net:4317
     headers:
       api-key: YOUR_KEY_HERE

 service:
   pipelines:
     metrics:
       receivers: [hostmetrics]
       processors: [batch, resourcedetection, resource, cumulativetodelta]
       exporters: [otlp]
Notice that cpu and disk have been commented out, as they have not been implemented in this version. However, if you try anyway, you may get a few storage metrics.
-
Edit
otel-config_mac.yamland replaceYOUR_KEY_HEREwith your Ingest - License key from New Relic. - Run this command to start the OpenTelemetry Collector:
./otelcol-contrib --config=file:./otel-config_mac.yaml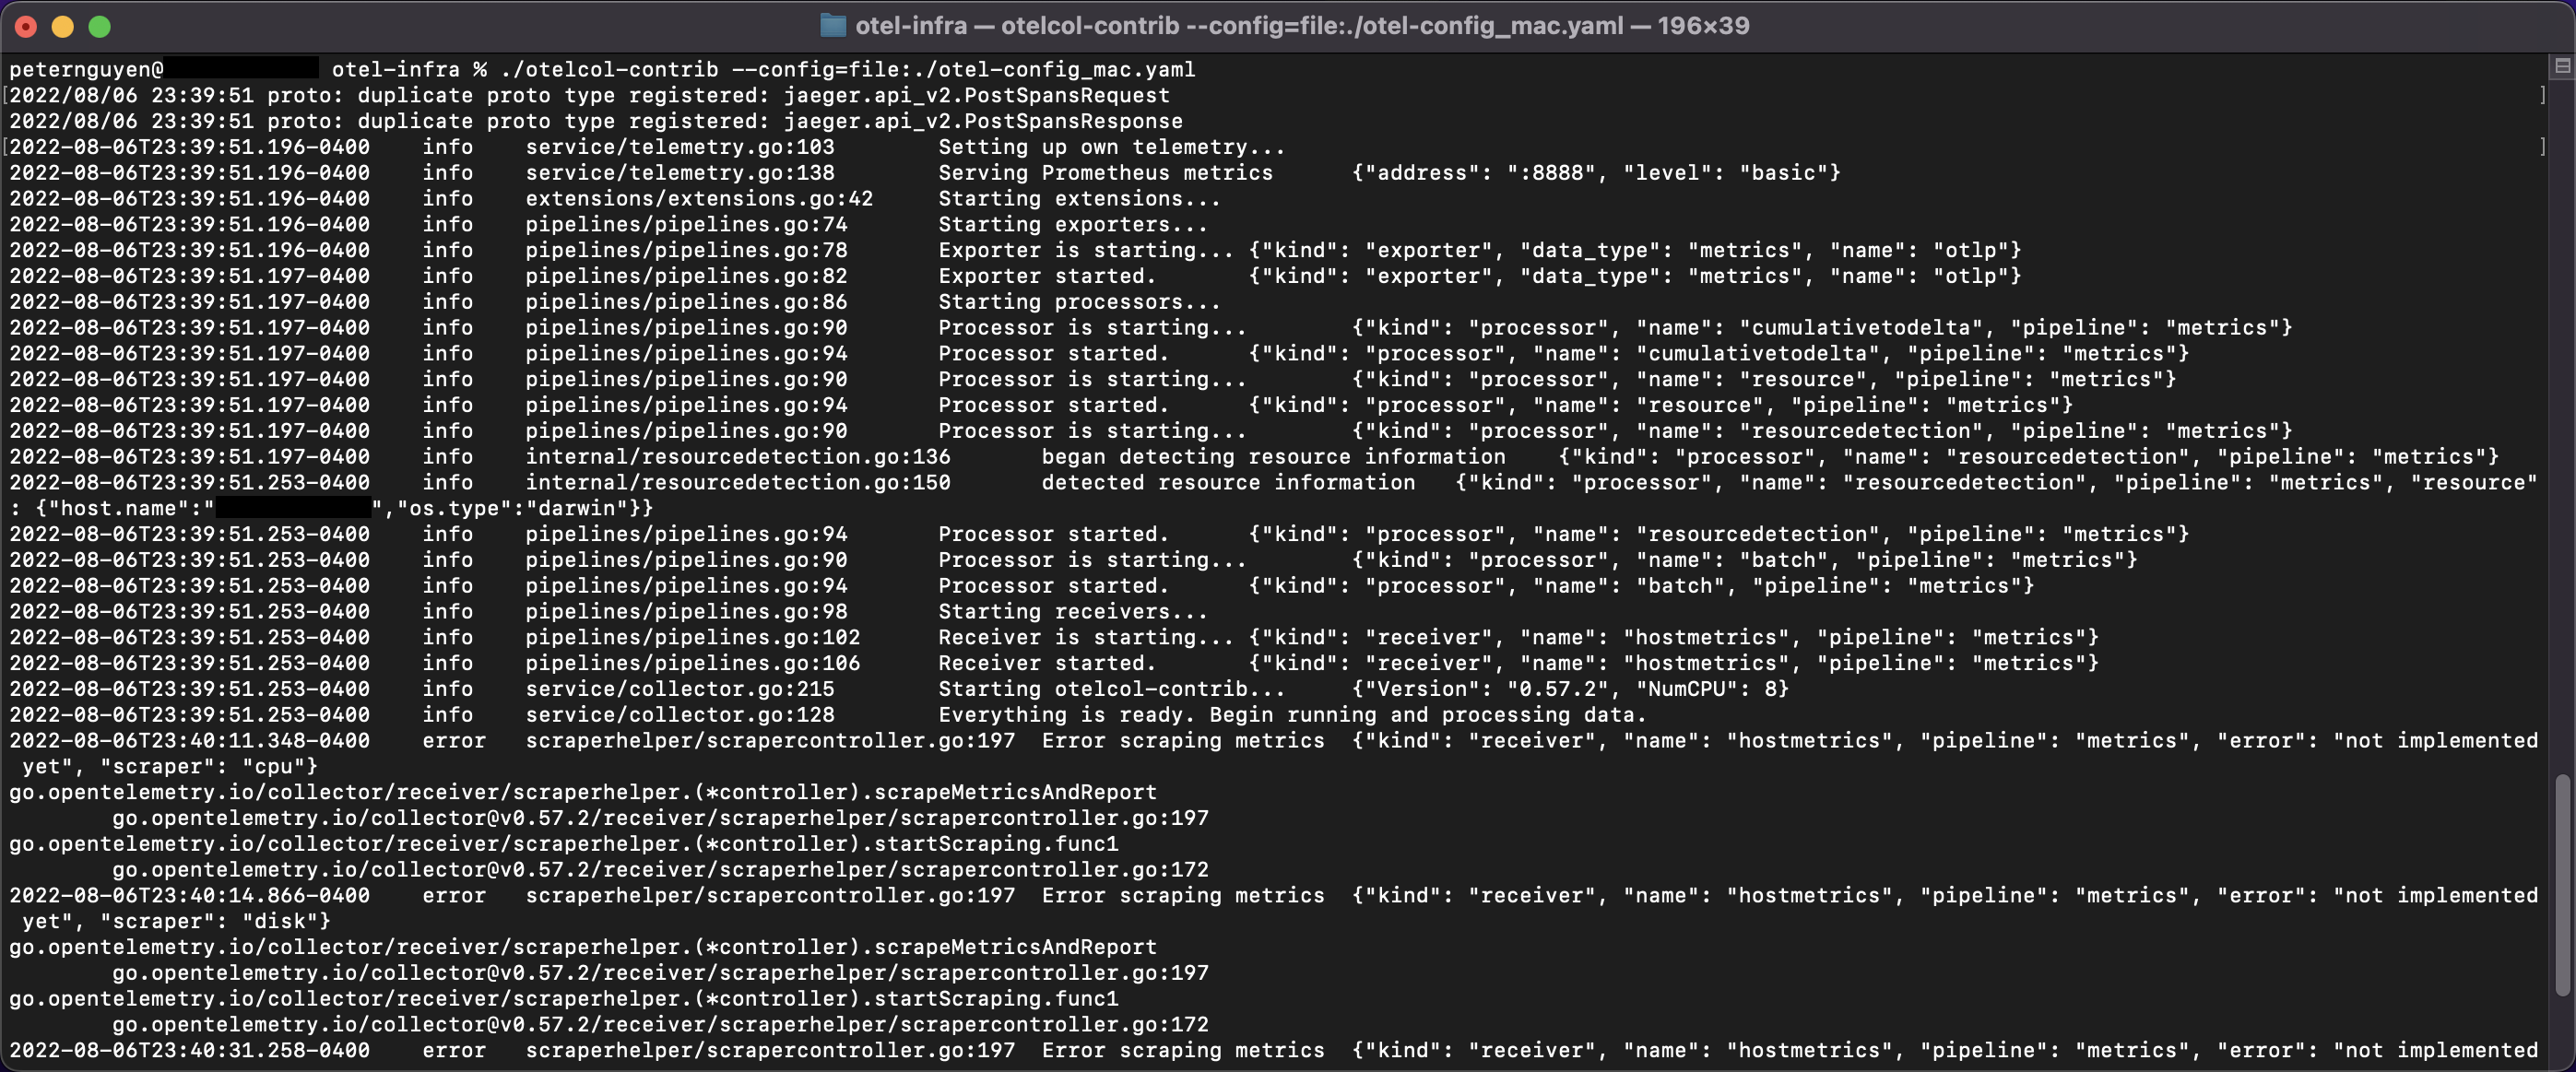
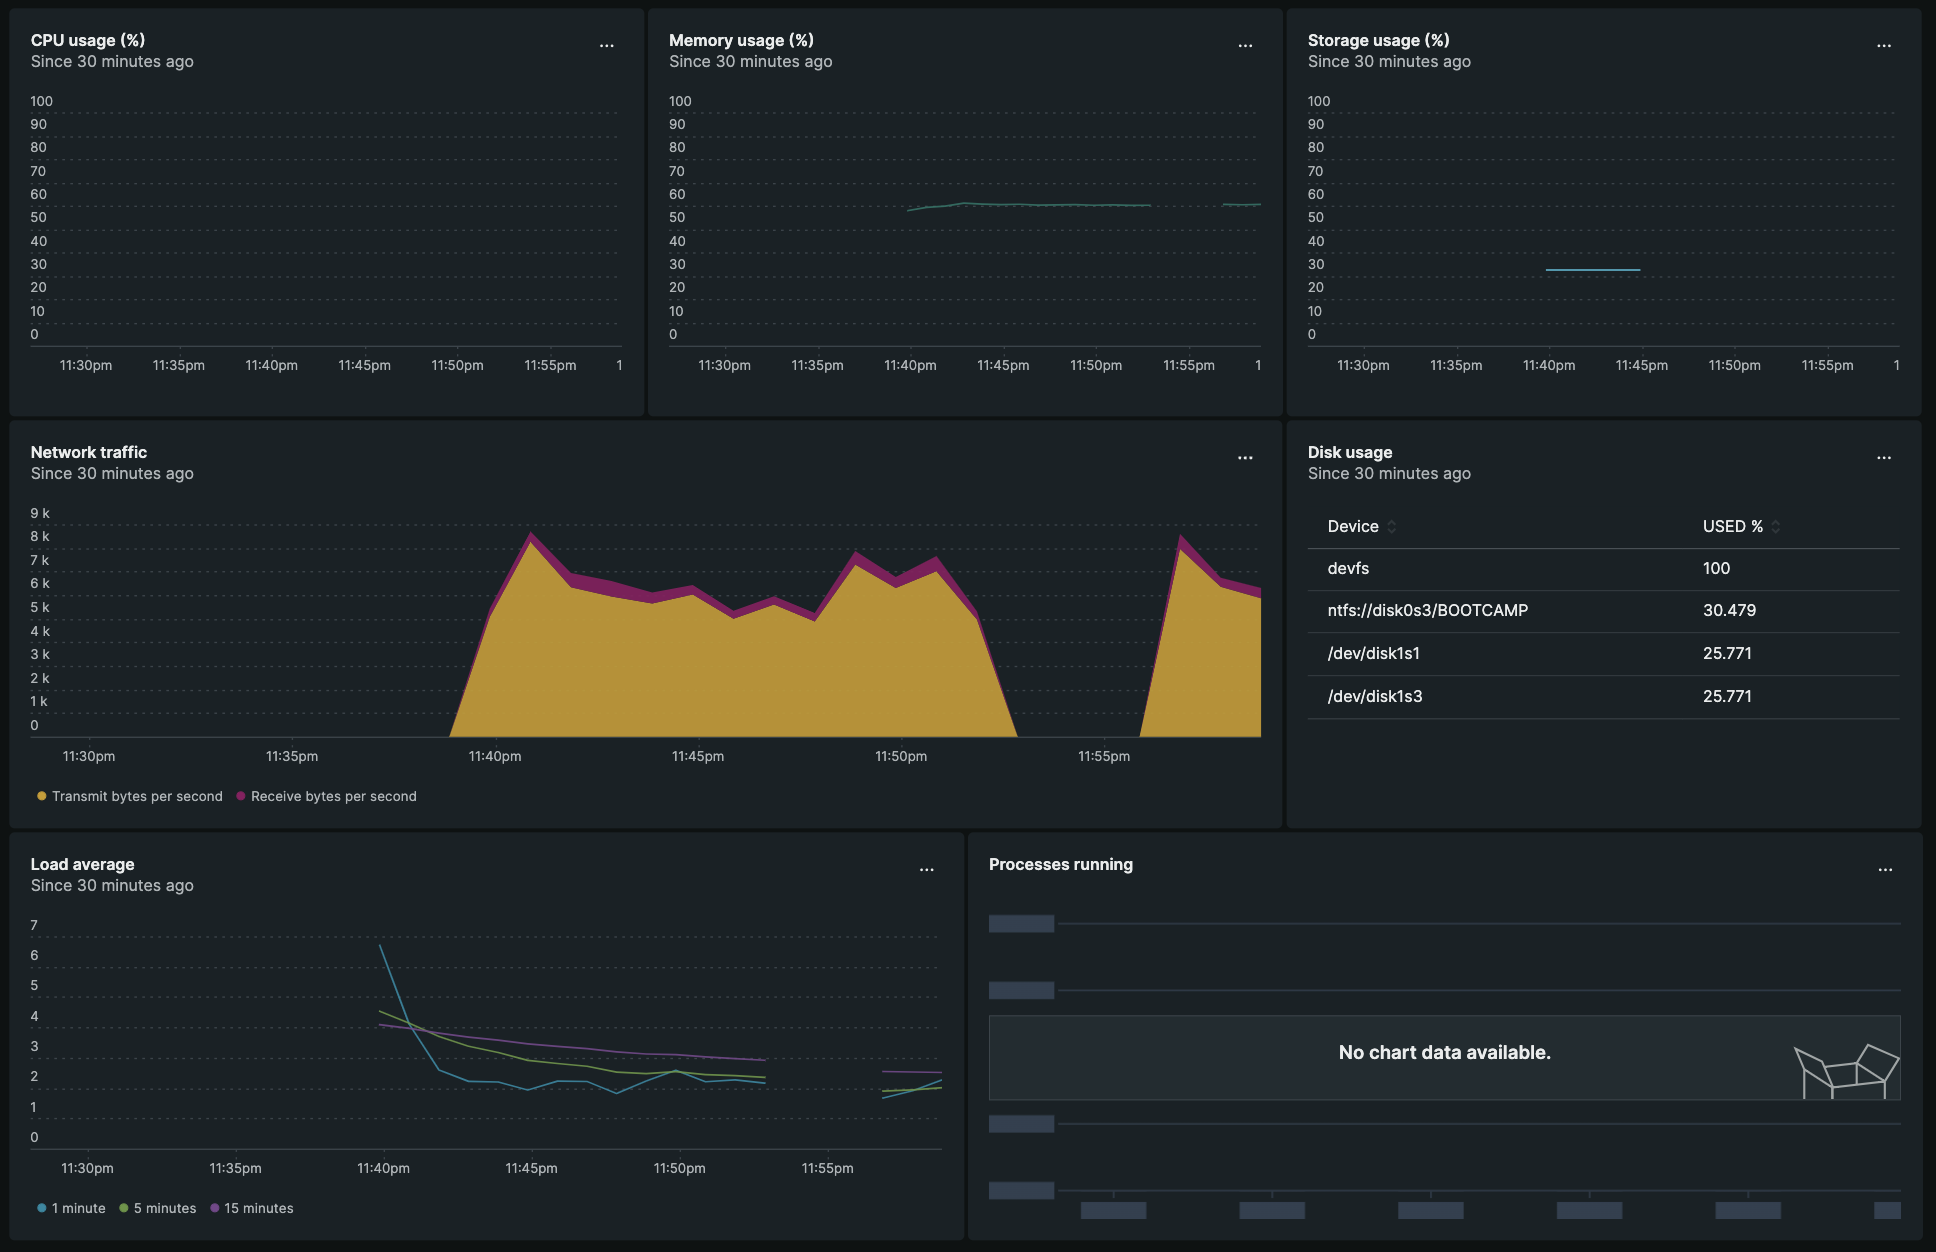
- Log into New Relic and check the results.
Remarks
Overall, collecting host metrics with the OpenTelemtry Collector Contrib package is still beta, and breaking changes can happen in future releases. However, the progress so far is quite impressive. Feel free to check out the Host Metrics Reciever Readme for updates.